Spatial Transcriptomics Technologies

spatial transcriptomics
experimental design

Explore the current landscape of spatial transcriptomics technologies, focusing on contrasting sequencing-based and imaging-based platforms to show how they differ in resolution, throughput and sensitivity. By the end, you will be informed on which technology is best suited for your biological question.

Authors

Noor Sohail

Pratyusha Bala

Mandovi Chatterjee

Published

July 22, 2025

Keywords

Imaging-based, Sequencing-based, Visium, MERFISH, seqFISH

Approximate time: 30 minutes

Learning objectives

In this lesson, we will:

  • Describe the evolution of high-throughput sequencing
  • Highlight the differences between sequencing- and imaging-based technologies
  • Define the advantages and disadvantages of different spatial transcriptomics technologies

Overview of lesson

Before we touch any data, we need to orient ourselves on the spatial transcriptomics landscape. In this lesson we compare imaging- (MERFish, Xenium) and sequencing-based platforms (Visium HD, Slide-seq) so that you can make sense of which technology is right for your research question. Each method is different in its resolution, coverage, tissue compatibility and practical constraints.

Knowing the advantages and disadvantages of each method will allow you to make an informed decision about which technology is best for your research question. In addition, some computational methods/algorithms are better suited to certain types of spatial transcriptomics results.

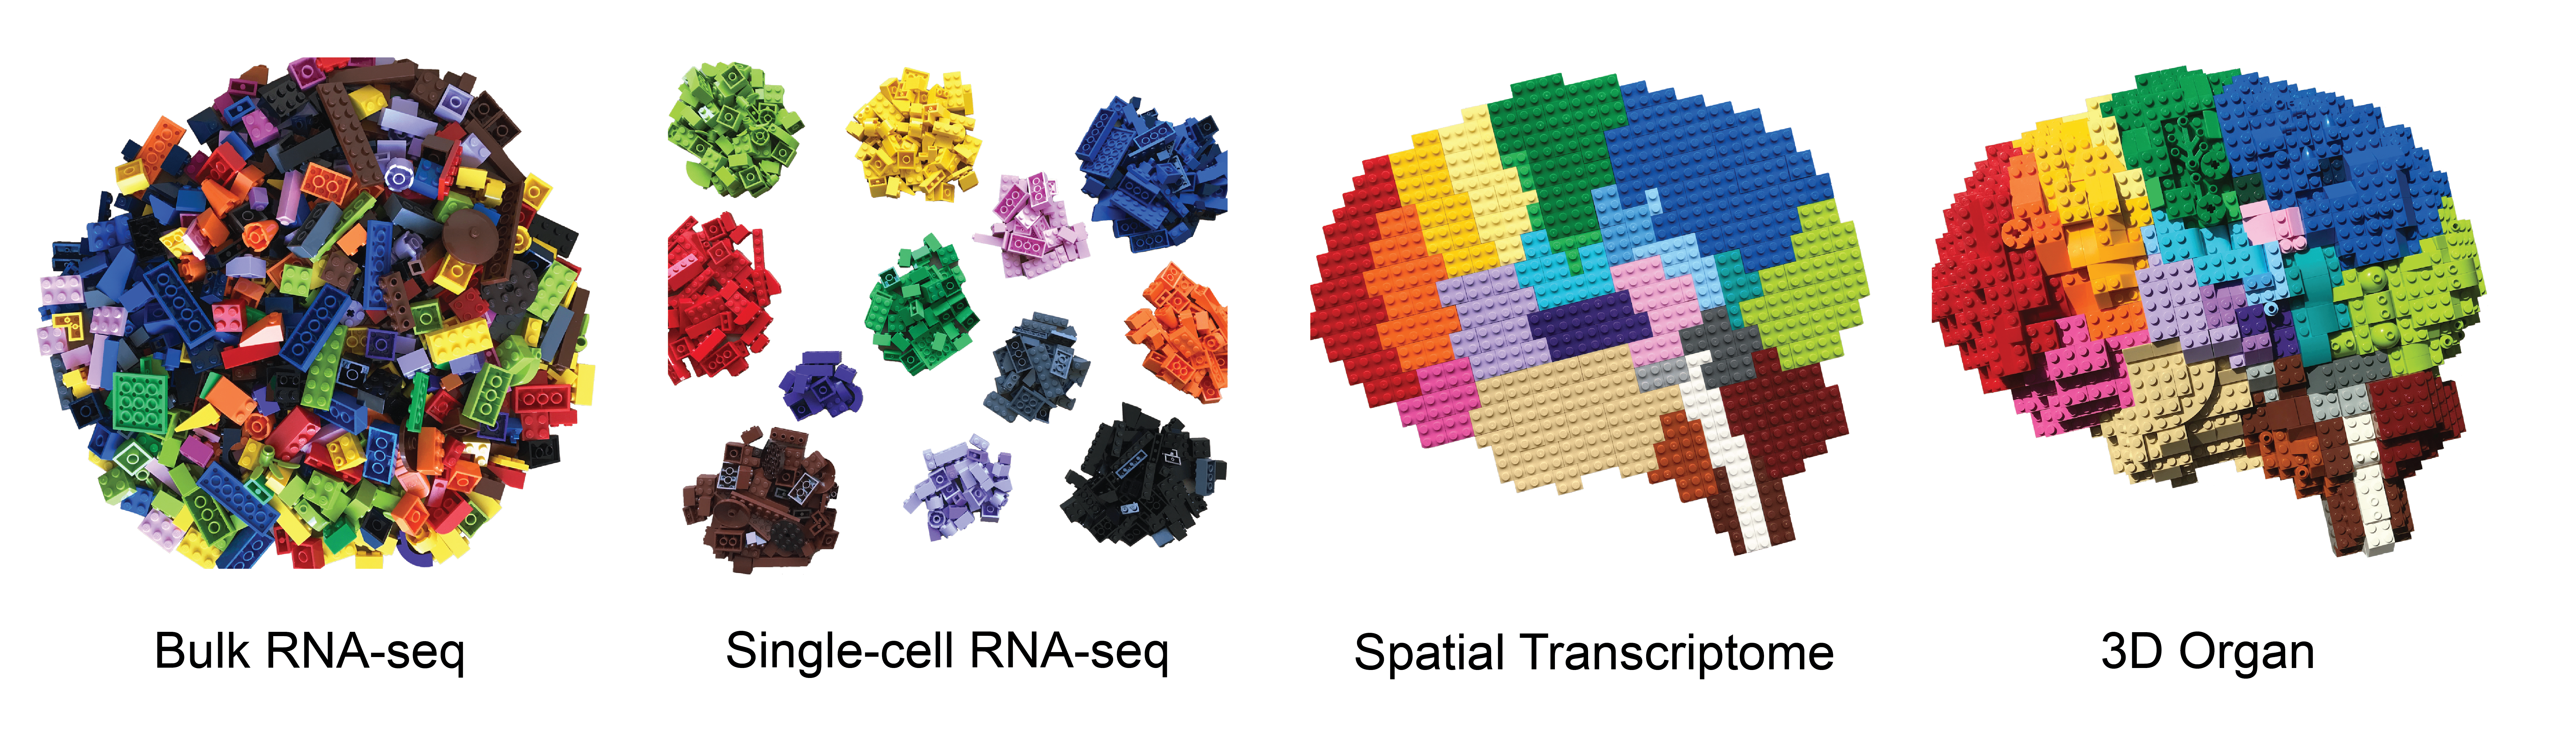
High-throughput sequencing overview

Over the years, transcriptomics technologies have evolved rapidly from bulk sequencing, to single-cell sequencing, all the way to the current spatial transcriptomics methods.

Figure 1: Lego representation of the evolution of sequencing technologies, showing more specificity and structure with each advancement.
Image source: Bo Xia Lab

Bulk and single-cell sequencing

Bulk RNA-seq is a method for comparing the averages of cellular expression for a population of cells. This method can be a good choice if looking at comparative transcriptomics (e.g., samples of the same tissue from different species) and for quantifying expression signatures in disease studies. It also has potential for the discovery of disease biomarkers if you are not expecting or not concerned about cellular heterogeneity in the sample.

To contrast, single-cell sequencing is a method for measuring gene expression on a per-cell basis. This method is ideal for studies containing cellular heterogeneity where the differences between cell types or cell states are the primary focus.

Figure 2: Comparison of bulk and single-cell RNA sequencing approaches, showcasing loss of cellular resolution in bulk due to averaging.
Image source: Trapnell et al. (2015)

To give an example, if we look at the image above, we can see that there are two cell types (blue and green) that have different expression patterns for genes A and B. If we were to analyze this data in bulk (left), we would not be able to detect the correct association between the genes. However, if we properly group the cells by cell type (right), we can see the correct correlation between the genes.

Spatial transcriptomics

Spatial transcriptomics extends the concept of single-cell sequencing further by adding the coordinates for each cell or spot on a slide. This allows us to understand both the molecular and spatial context for gene expression.

Figure 3: Overview of different analyses that can be performed using spatial transcriptomics.
Image source: Lázár et al. (2025)

Studies that focus on the tissue microenvironment benefit from the captured location information. Different niches, or local structures in the tissue, can be dissected to establish unique gene expression or unique, spatially defined cell states. Cell-cell communication analyses also use the distance between cells to identify whether or not certain cells are likely to interact with one another.

Another application is the ability to annotate key areas of a tissue based upon the histological features of the tissue, which can be particularly useful for studies of cancer and other diseases. The histology annotations typically come in the form of hematoxylin and eosin (H&E) stains. Nuclei will be stained a purple/blue hue by the hematoxylin, and eosin colors the cytoplasm pink. Pathologists can use these stains to identify key areas of a tissue, as shown below:

Figure 4: Example of histology slide from a liver biopsy, annotated by a pathologist.
Image source: Holzinger et al. (2019)

Spatial transcriptomic technologies can be broadly categorized into two groups: sequencing-based and imaging-based. We will now discuss the different technologies within each of these categories as well as their advantages and disadvantages.

Figure 5: Overview of different spatial transcriptomics methods, showcasing each results in a counts matrix with associated x, y spatial coordinates.
Image source: Rao et al. (2025)

Sequencing-based technologies

Sequencing-based methods, like Visium, are sometimes referred to as “spot-based methods” because the tissue is placed on a slide with a grid-like pattern. In Visium HD, each spot on the grid has a unique sequence (barcode) associated with its location, similar to a microarray. After the permeabilization step, RNA from the tissue binds to these barcode capture probes. Because we already know the location of each barcode in advance, we know which bin/spot a read comes from. Therefore, the output is the gene expression of each bin as well as its associated location on the tissue.

Figure 6: Comparison of Visium and Visium HD data in FFPE human colorectal cancer, showcasing the resolution that can be achieved with sequencing-based methods.
Image source: 10X Genomics: Your Introduction to Visium HD

The sizes of these spots vary per technology. Earlier sequencing-based methods had larger bins, which could contain several cells per spot. As the technology has evolved, the bin sizes have become smaller, allowing for near single-cell resolution.

Advantages and disadvantages

Advantages:

  • Analyses that make use of many genes at once (functional analysis, RNA velocity, etc.) can be done on these datasets as you are sequencing the entire transcriptome instead of a gene panel
  • Can be run on non-model organisms with greater ease

Disadvantages:

  • High-resolution experiments (Visium HD) can be very expensive
  • Spots are not guaranteed to be a single cell (can be multiple cells, or no cells at all)

Imaging-based technologies

Figure 7: Showcase of MERFISH, an imaging-based technology, which can achieve single-cell resolution of tissues.
Image source: Vizgen: Leading the Global Expansion of Spatial Transcriptomics

Imaging-based spatial transcriptomics directly visualise and quantify RNA in situ by using gene-specific probes, often achieving subcellular or single-molecule resolution. Most often, the probes are detected using secondary fluorescent probes with or without signal amplification. The probe design, optics of the microscope, and method of decoding the signal define the plexity and sensitivity of these assays. MERSCOPE is built upon FISH imaging with multiple probes spanning the RNA transcript and an error-robust decoding principle, making it the most sensitive spatial transcriptomics technology.

Figure 8: Schematic of how cell boundaries are establieshed using nuclear stain, cell boundary stains, and transcripts to identify cellular boundaries.
Image source: Heidari et al. (2025)

These technologies also allow us to use DAPI, Poly-T, or specific cell segmentation stains on the same slide used for transcriptomics. This allows for the identification of cell boundaries to map transcripts to a single cell. In this way, imaging-based technologies are able to capture single-cell level resolution of tissues for the provided set of probes. The challenge, however, is plexity, with technologies profiling up to a few thousand genes per experiment.

Advantages and disadvantages

Advantages:

  • Can be used to evaluate the expression of a select panel of genes with high sensitivity and specificity
  • Single-cell resolution

Disadvantages:

  • Limited to a select panel of genes
  • Segmentation is not a trivial task and requires careful pre-processing
  • Challenging with non-model organisms as probes are necessary

Summary of comparison

Table 3: Summary of the advantages and disadvantages of sequencing- and imaging-based spatial transcriptomics technologies.
Adapted from: Single Cell Discoveries
Feature Sequencing-based Imaging-based
What they measure Whole transcriptome Targeted panels
Spatial resolution Multi-cell (spots/bins) to single cell Single cell
Sensitivity Broad detection; may miss low-abundance genes High for targeted genes
Limitations Mixing of cells in one spot Limited number of probes
Throughput (slides) High (parallel processing) Lower (multiple imaging cycles)
Throughput (genes) High (dozens of thousands) Limited (hundreds to thousands)
Cost Less upfront cost, amenable to smaller pilots Higher upfront cost for probe panel, larger area per slide can minimise costs per sample
Best for… Discovery projects Validation projects

Next Lesson >>

Back to Schedule

Reuse

CC-BY-4.0