?FindMarkersDE analysis using FindMarkers
Approximate time: 75 minutes
Learning Objectives:
- Evaluate differential gene expression between conditions using a Wilcoxon rank sum test
Differential expression between conditions using FindMarkers()
In our current UMAP, we have merged samples across the different conditions and used integration to align cells of the same celltype across samples. Now, what if we were interested in a particular celltype and understanding how gene expression changes across the different conditions?
The FindMarkers() function in the Seurat package is used to perform differential expression analysis between groups of cells. We provide arguments to specify ident.1 and ident.2 the two groups of cells we are interested in comparing. This function is commonly used at the celltype annotation step, but can also be used to calculate differentially expressed genes between experimental conditions.
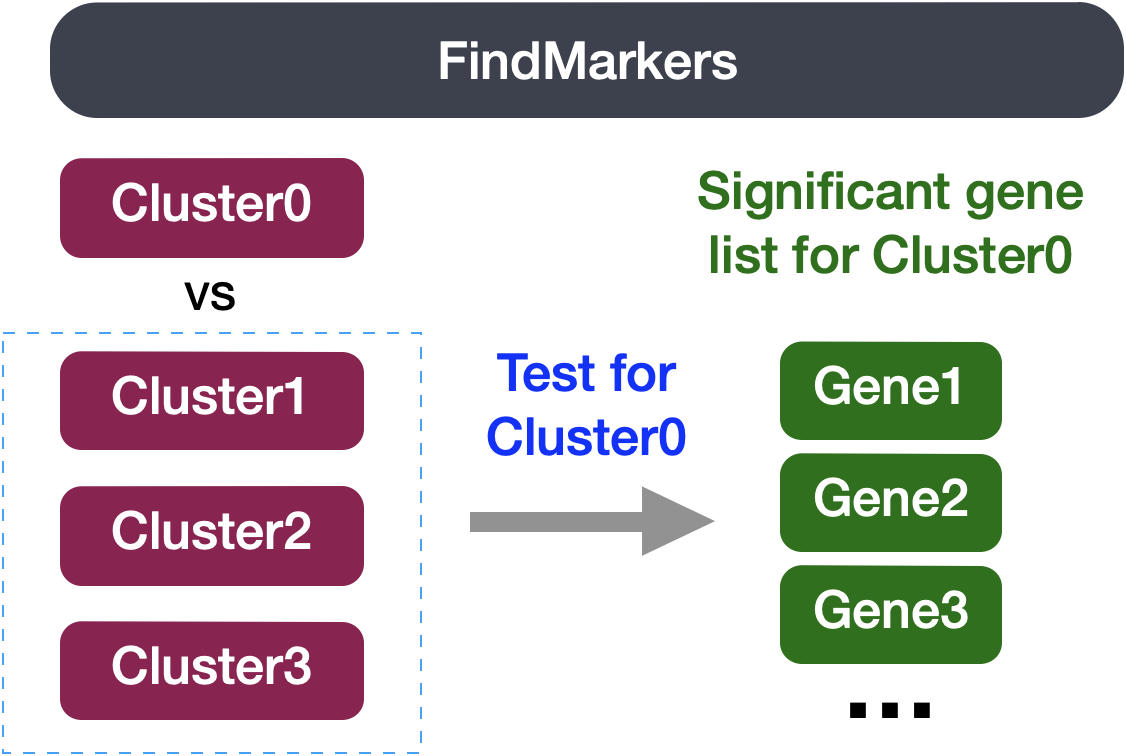
We can use this same function to compare two groups of cells which represent different conditions by modifying the ident values provided. The FindMarkers() function has several important arguments we can modify when running it. To view what these parameters are, we can access the help page on this function:
Below we have described in more detail what each of these arguments mean :
logfc.threshold: The minimum log2 fold change for average expression of gene in group relative to the average expression in all other groups combined. Default is 0.25.min.diff.pct: The minimum percent difference between the percent of cells expressing the gene in the group and the percent of cells expressing gene in all other groups combined.min.pct: Only test genes that are detected in a minimum fraction of cells in either of the two populations. Meant to speed up the function by not testing genes that are very infrequently expressed. Default is 0.1.ident.1: This function only evaluates one group at a time; here you would specify the group of interest. These values must be set in theIdents().ident.2: Here you would specify the group you want to compareident.1against.
Setting up
Open up a new Rscript file, and start with some comments to indicate what this file is going to contain:
# Single-cell RNA-seq DE analysis - FindMarkersSave the Rscript as findMarkers.R.
Load libraries
Now let’s load the required libraries for this analysis:
# Load libraries
library(Seurat)
library(tidyverse)
library(EnhancedVolcano)
FindMarkers()
To use the function to look for DE genes between conditions, there are two things we need to do:
- Subset the Seurat object to our celltype of interest
- Set our active Idents to be the metadata column which specifies what condition each cell is
In our example we are focusing on vascular smooth muscle (VSM) cells. The comparison we will be making is TN vs. cold7.
# Subset the object
seurat_vsm <- subset(seurat, subset = (celltype == "VSM"))

# Set the idents
Idents(seurat_vsm) <- "condition"
seurat_vsm
An object of class Seurat
40338 features across 12372 samples within 3 assays
Active assay: RNA (19771 features, 3000 variable features)
2 layers present: data, counts
2 other assays present: SCT, integrated
2 dimensional reductions calculated: pca, umapBefore we make our comparisons we will explicitly set our default assay, we want to use the normalized data, not the integrated data.
# Set default assay
DefaultAssay(seurat_vsm) <- "RNA"
The default assay should have already been RNA, but we encourage you to run this line of code above to be absolutely sure in case the active slot was changed somewhere upstream in your analysis.
Why don’t we use SCT normalized data?
Note that the raw and normalized counts are stored in the counts and data slots of RNA assay, respectively. By default, the functions for finding markers will use normalized data if RNA is the DefaultAssay. The number of features in the RNA assay corresponds to all genes in our dataset.
Now if we consider the SCT assay, functions for finding markers would use the scale.data slot which is the pearson residuals that come out of regularized NB regression. Differential expression on these values can be difficult interpret. Additionally, only the variable features are represented in this assay and so we may not have data for some of our marker genes.
Now we can run FindMarkers():
# Determine differentiating markers for TN and cold7
dge_vsm <- FindMarkers(seurat_vsm,
                       ident.1="cold7",
                       ident.2="TN")

# Store the rownames (genes) as a column
dge_vsm$gene <- rownames(dge_vsm)
Now let’s take a quick look at the results:
# View results
View(dge_vsm)
The output from the FindMarkers() function is a matrix containing a ranked list of differentially expressed genes listed by gene ID and associated statistics. We describe some of these columns below:
- gene: The gene symbol
- p_val: The p-value not adjusted for multiple test corrections
- avg_logFC: The average log-fold change between sample groups. Positive values indicate that the gene is more highly expressed
ident.1.
- pct.1: The percentage of cells where the gene is detected in
ident.1(cold7)
- pct.2: The percentage of cells where the gene is detected on average in
ident.2(TN) - p_val_adj: The adjusted p-value, based on Bonferroni correction using all genes in the dataset, used to determine significance
Note
These tests treat each cell as an independent replicate and ignore inherent correlations between cells originating from the same sample. This results in highly inflated p-values for each gene. Studies have been shown to find a large number of false positive associations with these results.
When looking at the output, we suggest looking for markers with large differences in expression between pct.1 and pct.2 and larger fold changes. For instance if pct.1 = 0.90 and pct.2 = 0.80, it may not be as exciting of a marker. However, if pct.2 = 0.1 instead, the bigger difference would be more convincing. Also of interest is whether the majority of cells expressing the gene are in the group of interest. If pct.1 is low, such as 0.3, it may not be as interesting. Both of these are also possible parameters to include when running the function, as described above.
This is a great spot to pause and save your results!
write.csv(dge_vsm, "results/findmarkers_vsm_cold7_vs_TN.csv")