library(tidyverse)
animals <- read.csv("../data/animals.csv", row.names=1)Day 4 Activities
Exercises
- Change the
animalsdata frame to a tibble calledanimals_tb. Save the row names to a column calledanimal_namesbefore turning it into a tibble.

animals_tb <- animals %>%
        rownames_to_column(var = "animal_names") %>%
        as_tibble()
animals_tb
# A tibble: 6 × 3
animal_names speed color
<chr> <dbl> <chr>
1 Elephant 40 Gray
2 Cheetah 120 Tan
3 Tortoise 0.1 Green
4 Hare 48 Grey
5 Lion 80 Tan
6 PolarBear 30 White- Use ggplot2 to plot the animal names (x-axis) versus the speed of the animal (y-axis) in
animals_tbusing a scatterplot. Customize the plot to display as shown below.

ggplot(animals_tb) +
        geom_point(aes(x = animal_names, y = speed), color = "purple") +
        theme_bw() +
        ggtitle("Speed Comparisons Between Animals") +
        ylab("Speed (km/h)") +
        xlab("Animal") +
        theme(plot.title=element_text(hjust=0.5))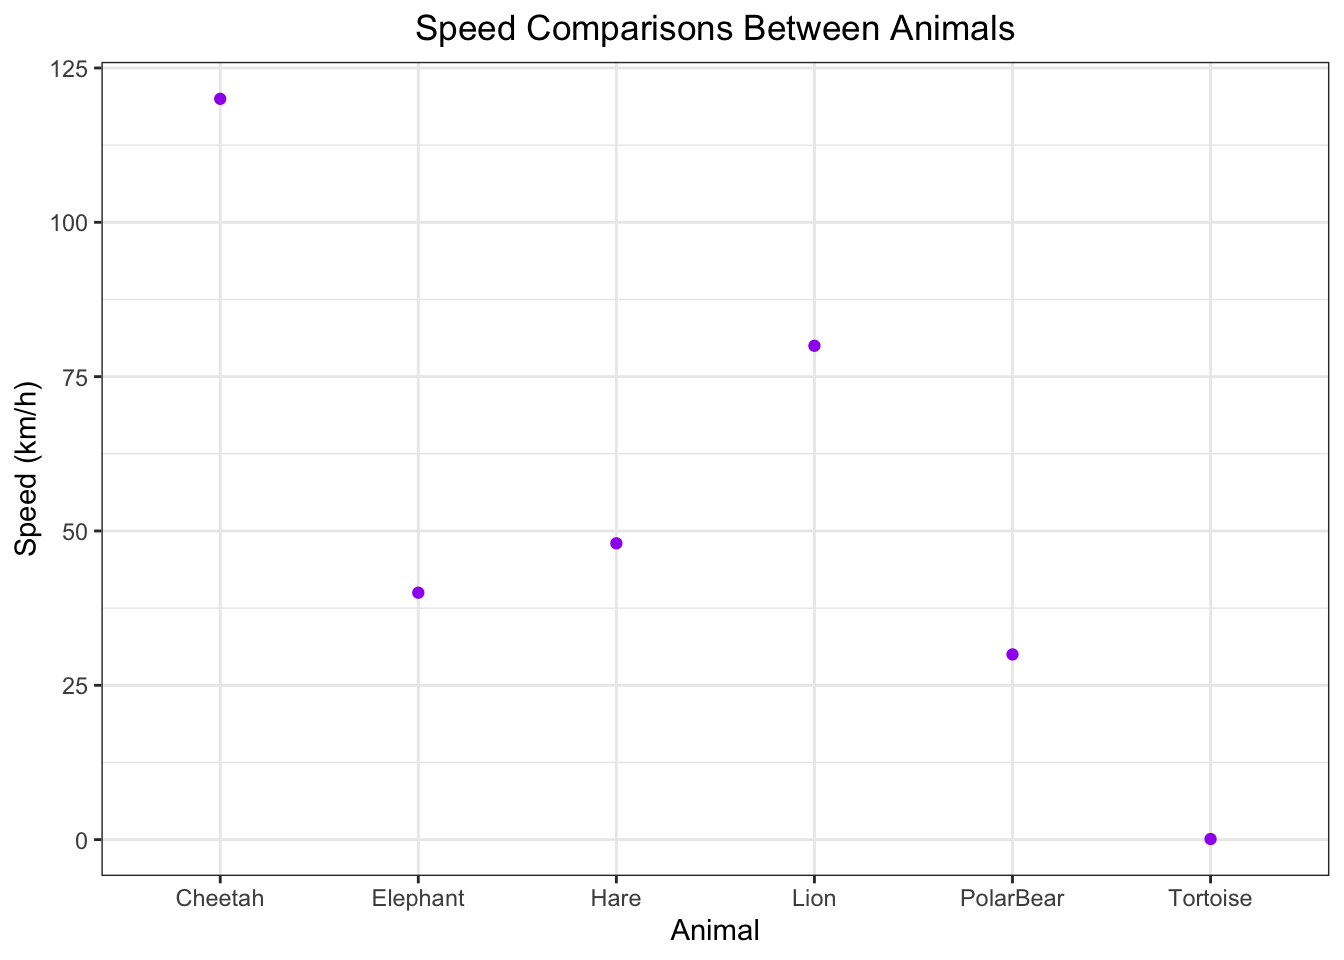
- We decide that our plot would look better with the animal names ordered from slowest to fastest. Using the
animals_tbtibble, reorder the animals on the x-axis to start with the slowest animal on the left-hand side of the plot to the fastest animal on the right-hand side of the plot by completing the following steps:
a. Use the arrange() function to order the rows by speed from slowest to fastest. Then use the pull() function to extract the animal_names column as a vector of character values. Save the new variable as names_ordered_by_speed.
names_ordered_by_speed <- animals_tb %>% arrange(speed) %>% pull(animal_names)
names_ordered_by_speed
[1] "Tortoise" "PolarBear" "Elephant" "Hare" "Lion" "Cheetah" b. Turn the animal_names column of animals_tb into a factor and specify the levels as names_ordered_by_speed from slowest to fastest (output in part a). Note: this step is crucial, because ggplot2 uses factor as plotting order, instead of the order we observe in data frame.
animals_tb$animal_names <- factor(animals_tb$animal_names,
                                  levels = names_ordered_by_speed)
animals_tb$animal_names
[1] Elephant Cheetah Tortoise Hare Lion PolarBear
Levels: Tortoise PolarBear Elephant Hare Lion Cheetahc. Re-plot the scatterplot with the animal names in order from slowest to fastest.

ggplot(animals_tb) +
        geom_point(aes(x = animal_names, y = speed), color = "purple") +
        theme_bw() +
        ggtitle("Speed Comparisons Between Animals") +
        ylab("Speed (km/h)") +
        xlab("Animal") +
        theme(plot.title=element_text(hjust=0.5))
Note
If you are interested in exploring other ways to reorder a variable in ggplot2, refer to this post.
- Save the plot as a PDF called
animals_by_speed_scatterplot.pdfto theresultsfolder.
ggplot(animals_tb) +
        geom_point(aes(x = animal_names, y = speed), color = "purple") +
        theme_bw() +
        ggtitle("Speed Comparisons Between Animals") +
        ylab("Speed (km/h)") +
        xlab("Animal") +
        theme(plot.title=element_text(hjust=0.5))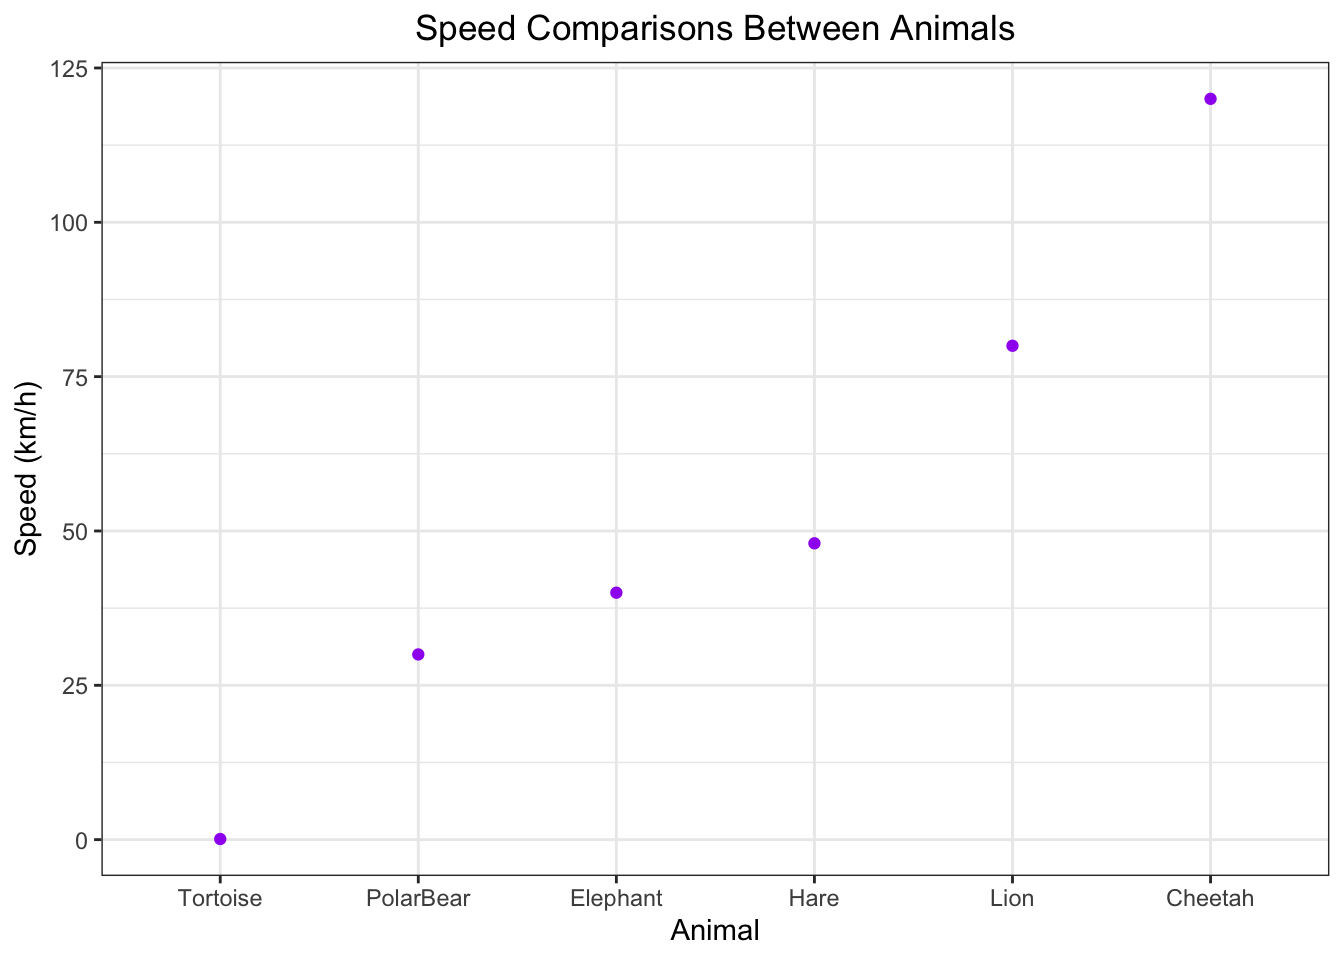
ggsave("../figures/animals_by_speed_scatterplot.pdf")- Use the functions from the
dplyrpackage to perform the following tasks:
a. Extract the rows of animals_tb tibble with color of gray or tan, order the rows based from slowest to fastest speed, and save to a variable called animals_gray_tan.

animals_gray_tan <- animals_tb %>%
        filter(color == "Gray" | color == "Tan") %>%
        arrange(speed)
animals_gray_tan
# A tibble: 3 × 3
animal_names speed color
<fct> <dbl> <chr>
1 Elephant 40 Gray
2 Lion 80 Tan
3 Cheetah 120 Tan b. Save animals_gray_tan as a comma-separated value file called animals_tb_ordered.csv to the results folder.
write.csv(animals_gray_tan,
          file = "../results/animals_tb_ordered.csv",
          quote = FALSE)