name_of_function <- function(arguments) {
    statements or code that does something
}Custom functions for consistent plots
Approximate time: 20 minutes
Learning Objectives
- Apply the custom function to generate consistent plots.
Consistent formatting using custom functions
When publishing, it is helpful to ensure all plots have similar formatting. To do this we can create a custom function with our preferences for the theme. Remember the structure of a function is:
Now, let’s suppose we always wanted our theme to include the following:
theme_bw() +
theme(axis.title=element_text(size=rel(1.5))) +
theme(plot.title=element_text(size=rel(1.5), hjust=0.5))
Note
You can also combine multiple arguments within the same theme() function:
theme_bw() +
theme(axis.title=element_text(size=rel(1.5)), plot.title=element_text(size=rel(1.5), hjust=0.5))
If there is nothing that we want to change when we run this, then we do not need to specify any arguments. Creating the function is simple; we can just put the code inside the {}:
personal_theme <- function(){
  theme_bw() +
  theme(axis.title=element_text(size=rel(1.5))) +
  theme(plot.title=element_text(size=rel(1.5), hjust=0.5))
}
Now to run our personal theme with any plot, we can use this function in place of the lines of theme() code:
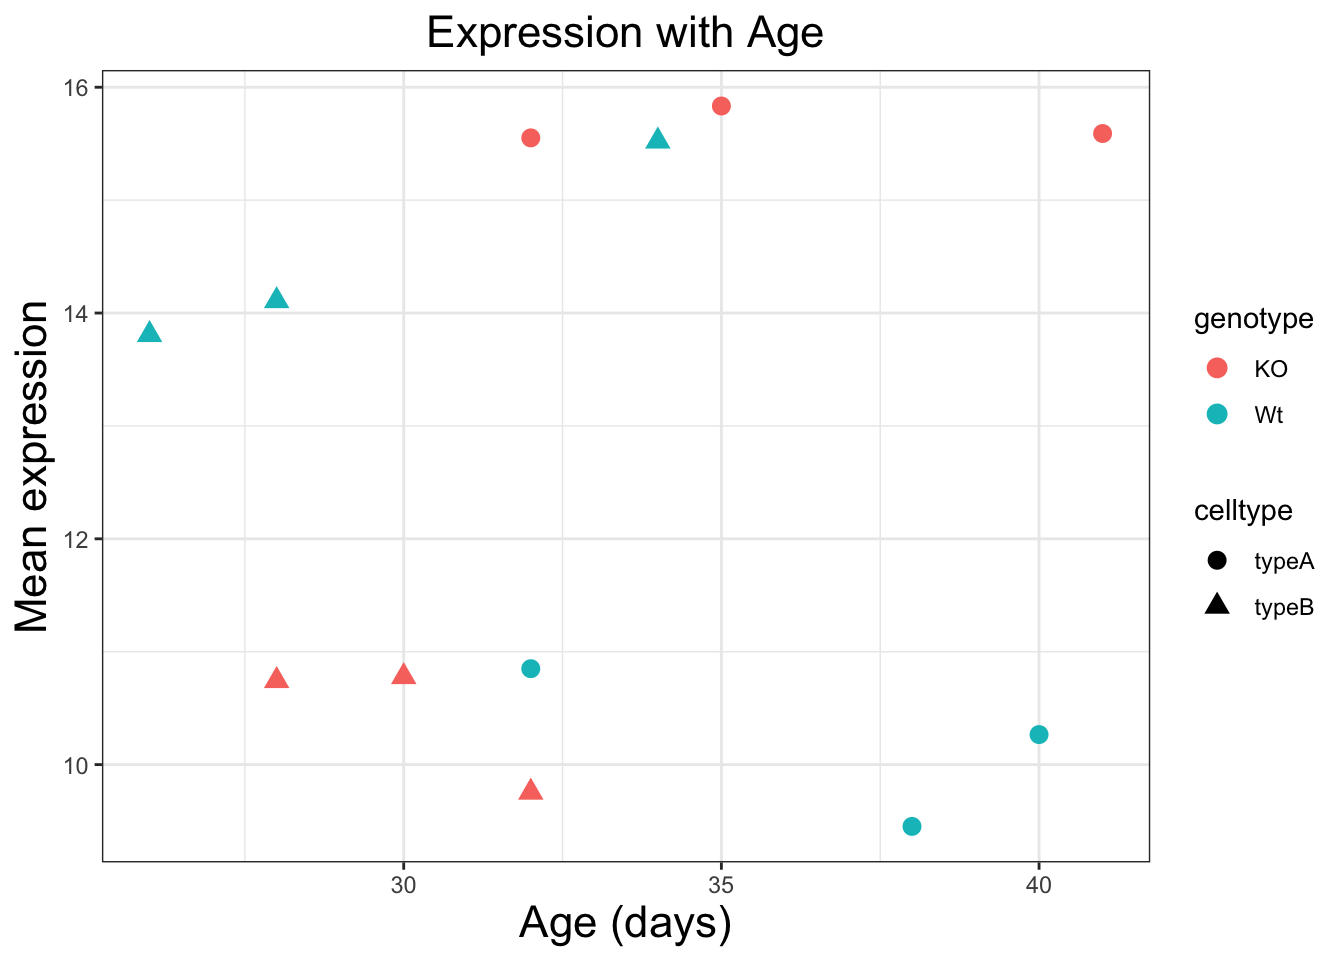
ggplot(new_metadata) +
  geom_point(aes(x=age_in_days, y=samplemeans, color=genotype, shape=celltype), size=rel(3.0)) +
  xlab("Age (days)") +
  ylab("Mean expression") +
  ggtitle("Expression with Age") +
  personal_theme()