Contributors: Meeta Mistry, Radhika Khetani, Jihe Liu, Mary Piper, Will Gammerdinger
Approximate time: 30 minutes
Learning Objectives
- Describe the elements of the BED file format and related file formats
- Employ the bedtools suite of tools to filter peak calls
- Compare peaks betweeen replicates using bedtools
Handling peak calls
Now that we have completed peak calling, we are ready to perform QC on our called peaks.
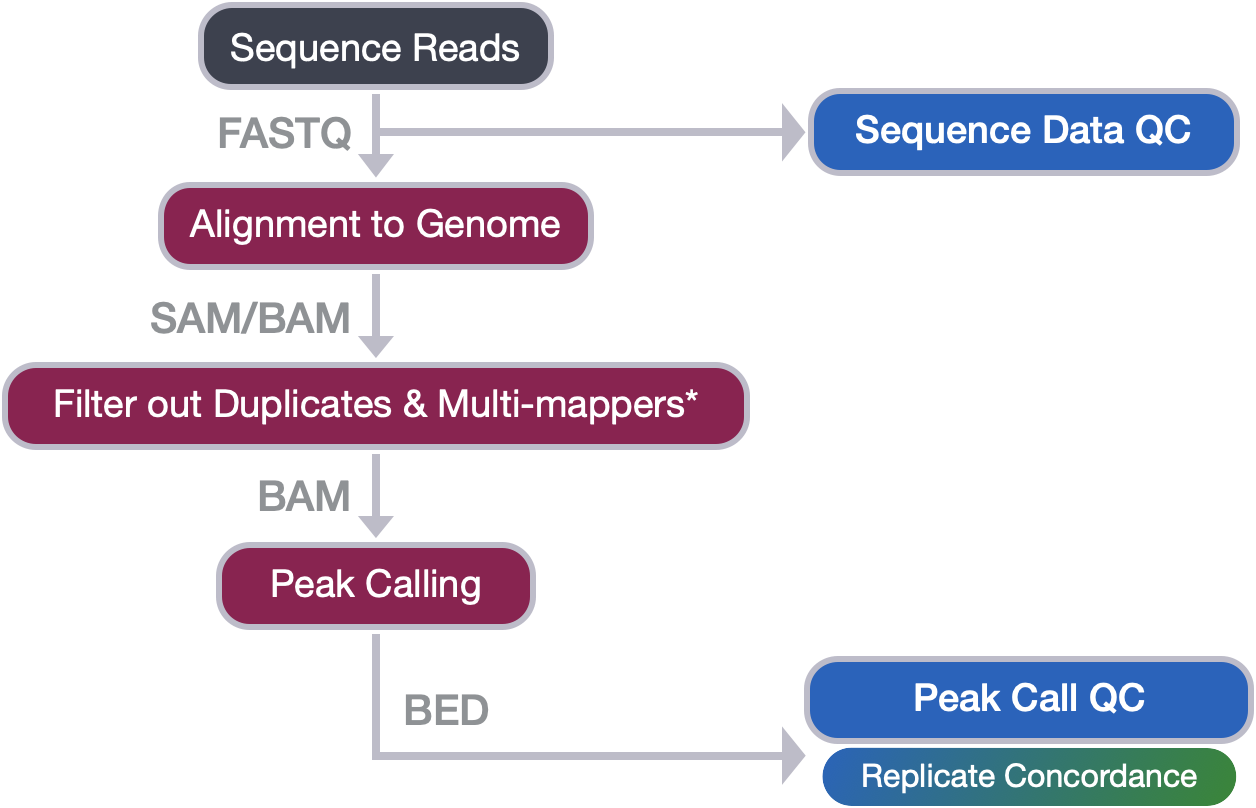
In this lesson, we will introduce you to an important file format that you will encounter when working with peak calls called the BED format (Browser Extensible Data). We will also describe the contents of the narrowPeak files (output from MACS2) and how it relates to BED.
We will use bedtools, a suite of tools that is very helpful when working with BED files and other related file formats, to complete the following tasks for the WT and KO peak calls from this PRDM16 dataset:
- Filter out peaks that overlap with the blacklisted regions
- Assess the replicate concordance within sample groups, to see how many peaks are reproducible.
BED file formats
BED
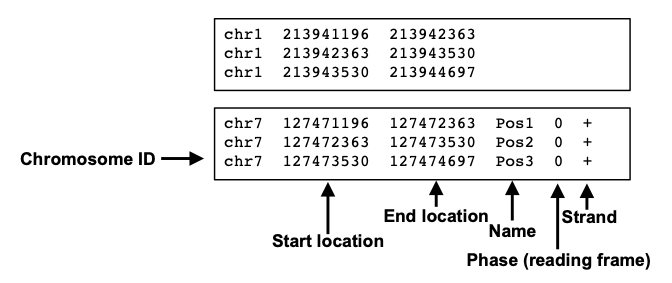
The BED file format is tab-delimited (columns separated by tabs) and contains information about the coordinates for particular genome features.
The coordinates in BED files are 0-based. What does this mean? Among standard file formats, genomic coordinates can be represented in two different ways as shown in the image below.
- Zero-based is shown at the top of the image. This is the preferred format for programmers.
- One-based is shown at the bottom. This is more intuitive and generally preferred by biologists.
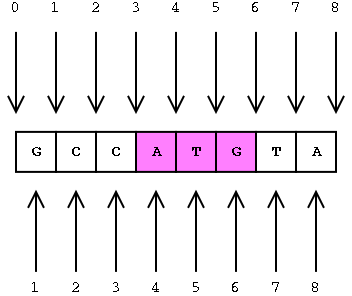
Given the example above, what coordinates would you use to define the sequence ATG?
- If you were using the the 1-based (bottom) method you would indicate 4 to 6.
- Using the 0-based method you would define the range as 3 to 6.
The benefits to having a zero-based system is the ease of calculating distance or length of sequences. We can easily determine the length of the ATG sequence using the zero-based coordinates by subtracting the start from the end, whereas for one-based coordinates we would need to add one after the subtraction. Therefore, many file formats used in computation, including the BED file format, use zero-based coordinates.
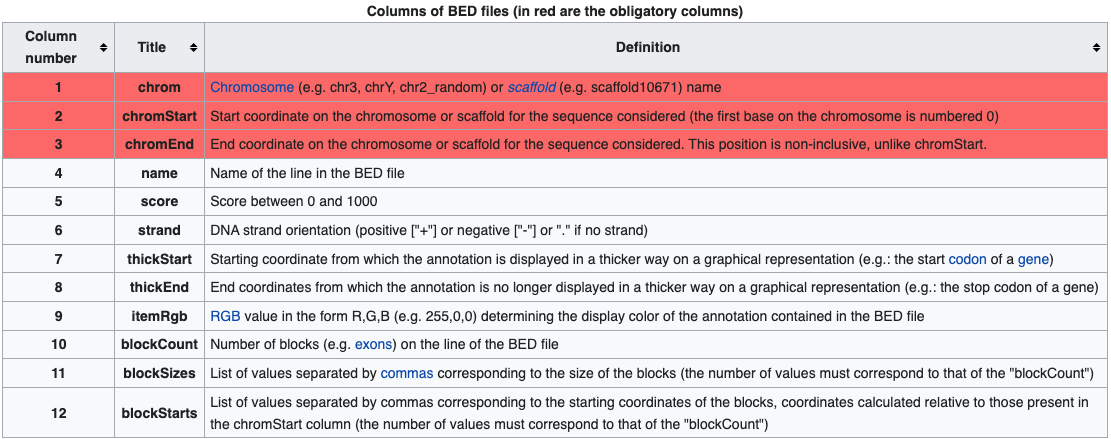
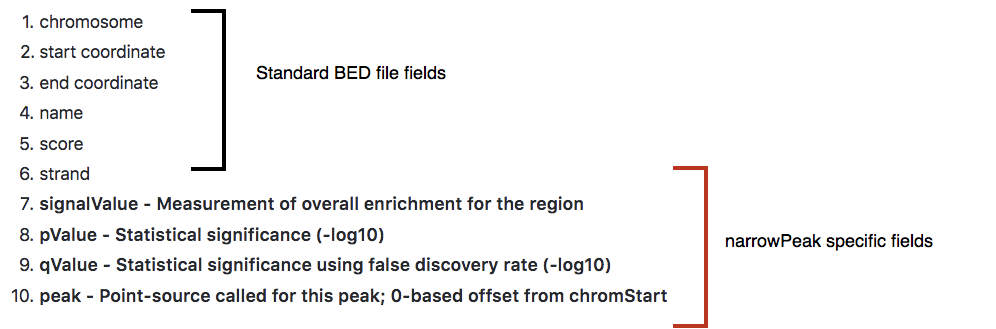
BED files require at least 3 fields indicating the genomic location of the feature, including the chromosome and the start and end coordinates. However, there are 9 additional fields that are optional, as shown in the image below.
narrowPeak
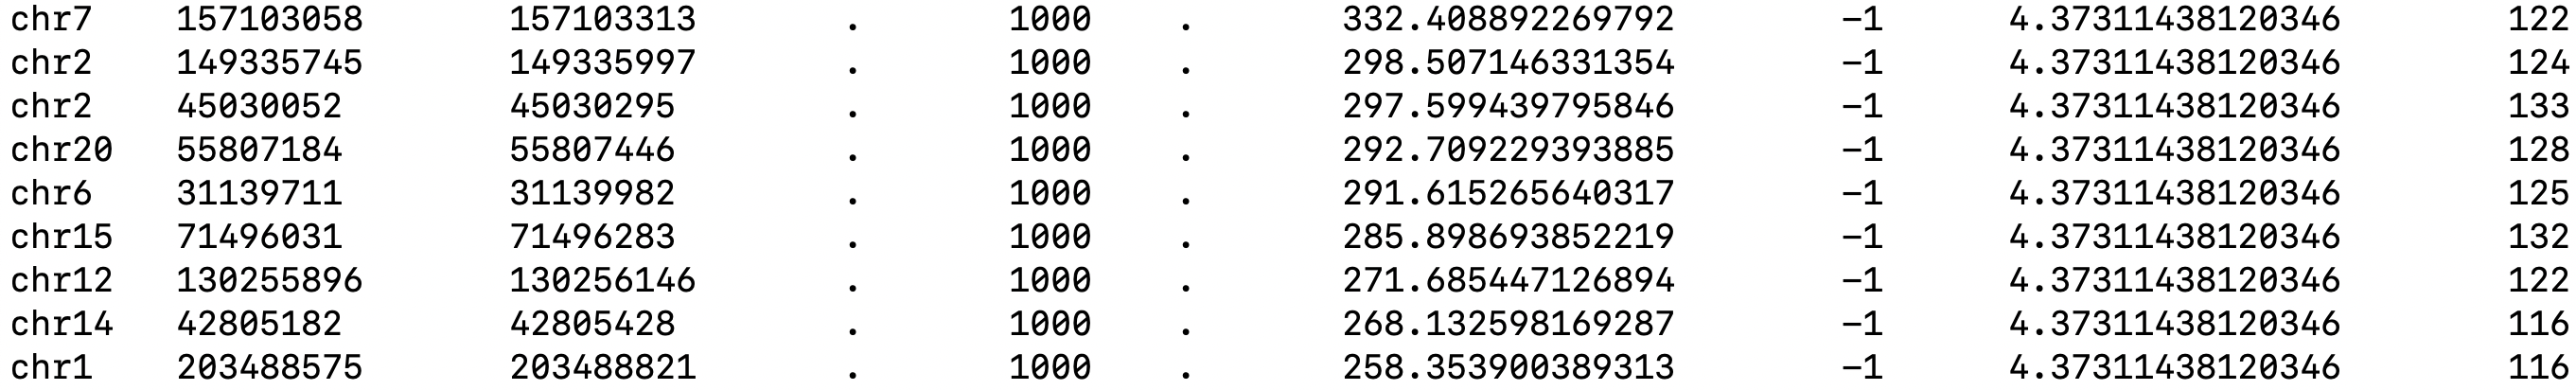
A narrowPeak (.narrowPeak) file is used by the ENCODE project to provide called peaks of signal enrichment based on pooled, normalized (interpreted) data. The narrowPeak file is a BED 6+4 format, which means the first 6 columns of a standard BED file with 4 additional fields:
Each row in the narrowPeak file represents a called peak. Below is an the example of a narrowPeak file, displaying the coordinate and statistical information for a handful of called peaks.
bedtools
The bedtools suite is like a swiss-army knife of tools for a wide-range of genomics analysis tasks. The general idea is that genome coordinate information can be used to perform relatively simple arithmetic, like combining, subsetting, intersecting etc., to obtain desired information. bedtools was devloped in Aaron Quinlan’s group at University of Utah, and is widely used amongst the bioinformatics community. It is such an easy and versatile tool to perform these tasks described above.
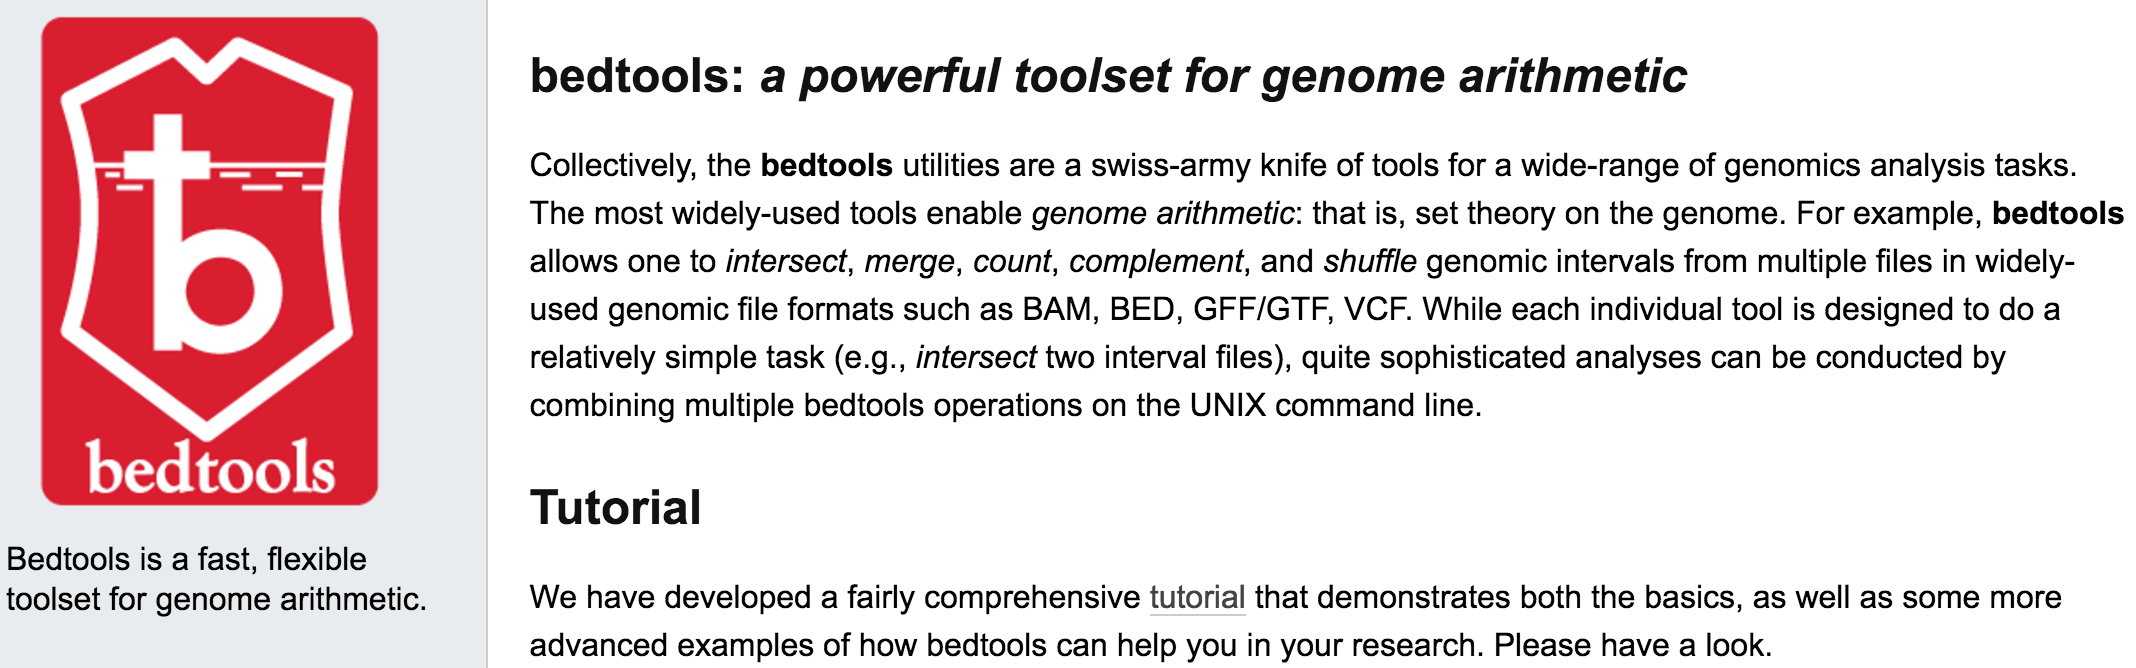
As the name implies, this suite of tools works with BED files, but it also works with other file formats that have genome coordinate information.

NOTE: When working with multiple files to perform arithmetic on genomic coordinates, it is essential that all files have coordinate information from the same version of the genome and the coordinate system (0-based or 1-based)!
bedtools is available as a module on O2. To set yourself up for the rest of the lesson, make sure you are logged into O2 and on a compute node.
$ srun --pty -p interactive -t 0-12:00 --mem 2G /bin/bash
Next, load the modules for bedtools and samtools:
$ module load gcc/6.2.0 bedtools/2.26.0 samtools/1.13
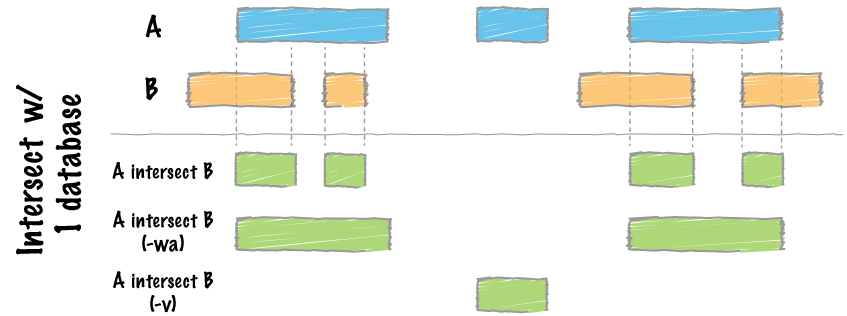
bedtools intersect
The bedtools intersect command within bedtools evaluates A (file 1) and finds regions that overlap in B (file 2). We will use this command to do both the filtering of peaks (from blacklisted regions) and assessing the overlap of peaks (between replicates).
NOTE: All of the operations performed below can similarly be used on peaks called from CUT&RUN and ATAC-seq data as well.
To find out more information on the parameters available when intersecting, use the help flag:
$ bedtools intersect -h
Alternatively, you can use the web-based documentation which is much easier to read. The “options” summary shows the large number of arguments available that allow us to do so much more than just a simple A versus B comparison. It allows one to have fine control as to how the intersections are reported, and work with different types of files; amongst many other features.
Filtering peaks overlapping with blacklist regions
We discussed blacklisted regions in the filtering lesson, as it is commonplace to filter before peak calling. When it is performed on BAM files, the bedtools intersect is also used, the difference being the input file type (BAM instead of BED). The filtering works just as well if applied post-peak calling, which is what we will be doing in this lesson.
The blacklisted regions typically appear uniquely mappable so simple mappability filters do not remove them. These regions are often found at specific types of repeats such as centromeres, telomeres and satellite repeats.
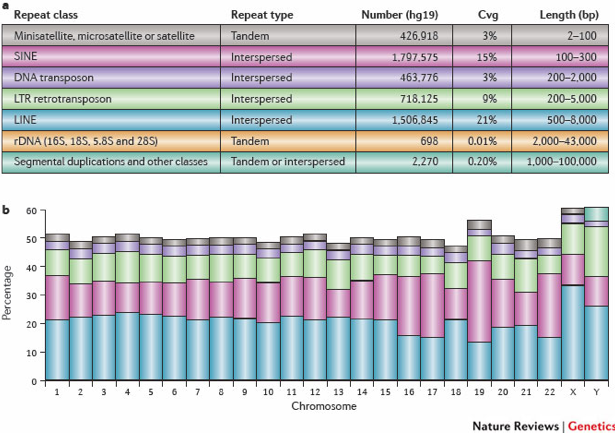
The table above shows various named classes of repeats in the human genome, along with their pattern of occurrence. The graph in the panel below shows the percentage of each chromosome (based on hg19), that is covered by repetitive DNA as reported by RepeatMasker. The colors in graph correspond to the colors of repeat class in the table.
Image source: Treangen, T.J. and Salzberg, S.L., Nature Reviews Genetics (2011)
We have a BED file of blacklist regions for mouse mm10 prepared for you. Copy this file over to your project into the reference_data folder.
$ cp /n/groups/hbctraining/harwell-datasets/workshop_material/reference/mm10-blacklist.v2.bed ~/chipseq_workshop/reference_data
How were the ‘blacklists compiled? These blacklists were empirically derived from large compendia of data using a combination of automated heuristics and manual curation. Blacklists were generated for various species and genome versions including human, mouse, worm and fly. The lists can be downloaded here. For human, they used 80 open chromatin tracks (DNase and FAIRE datasets) and 12 ChIP-seq input/control tracks spanning ~60 cell lines in total. These blacklists are applicable to functional genomic data based on short-read sequencing (20-100bp reads). These are not directly applicable to RNA-seq or any other transcriptome data types.
More information about the blacklist region is described in this paper. This is a more recent resource and the authors compiled blacklists that can be downloaded here. This is the source for the bed file used in this workshop.
Next, we will navigate to our results directory:
$ cd ~/chipseq_workshop/results/
To filter out blacklisted regions for wt_sample1, we use the following code. Note that we use the flag -v, to report entries in A that have no overlaps with B.
$ bedtools intersect \
-v \
-a macs2/wt_sample1_peaks.narrowPeak \
-b ../reference_data/mm10-blacklist.v2.bed \
> macs2/wt_sample1_peaks_filtered.bed
Similarly, we can filter out blacklisted regions for wt_sample2:
$ bedtools intersect \
-v \
-a macs2/wt_sample2_peaks.narrowPeak \
-b ../reference_data/mm10-blacklist.v2.bed \
> macs2/wt_sample2_peaks_filtered.bed
NOTE: The narrowPeak file also follows the bed file format. That’s why we could use it as an input, even though it does not end with the extension
.bed.
Exercise
Use the wc -l command to check how many peaks were filtered due to an overlap with blacklisted regions. Report the number of peaks before and after the filtering for each WT sample.
Finding overlapping peaks between replicates
The next use of bedtools intersect is to assess the concordance between replicates. We will do this for both the WT and KO sample groups. We will evaluate all peaks in the first replicate and see how many overlap in the second replicate. By default if two regions overlap by a minimum of one basepair, it is counted as an overlap. Since the default is a bit lenient, we have added some additional flags (described below) to increase the stringency for our final set of confident peaks per sample group.
-wo: Write the original A (file 1) and B (file 2) entries plus the number of base pairs of overlap between the two features.-f: Minimum overlap required as a fraction of A. The value ranges from 0 to 1. We will use 0.3, requiring the overlap region being at least 30% of A.-r: Require that the fraction overlap be reciprocal for A and B. Together with the-fflag above, we require the overlap region being at least 30% of B as well.
The code below generates the overlapping peaks:
$ bedtools intersect \
-wo -f 0.3 -r \
-a macs2/wt_sample1_peaks_filtered.bed \
-b macs2/wt_sample2_peaks_filtered.bed \
> macs2/wt_peaks_final.bed
Finally, let’s check how many confident peaks we are left with. Does this seem like a reasonable number of peaks to you? (You should get ~7,300 peaks)
wc -l ~/chipseq_workshop/results/macs2/wt_peaks_final.bed
Other approaches for assessing peak reproducibility
Historically, the ENCODE standard was using the overlaps that we described above but with a set of given criteria. This was developed based on experience with accumulated ENCODE ChIP-seq data, albeit with a much smaller sample size back then. In the paper Landt et al, 2018 describe the approach as:
“…either 80% of the top 40% of the peaks identified from one replicate using an acceptable scoring method should overlap the list of peaks from the other replicate, OR peak lists scored using all available reads from each replicate should share more than 75% of regions in common.”
Since then, the field has moved towards more statistically motivated approaches like the Irreproducibility Discovery Rate (IDR). The IDR framework was developed by Qunhua Li and Peter Bickel’s group. It compares a pair of ranked lists of regions/peaks and assigns values that reflect its reproducibility. You can read more about IDR and how it works in this linked lesson.
IDR analysis is extensively used by the ENCODE and modENCODE projects and is part of their ChIP-seq guidelines and standards. However, more recently there has been dicussion about the two approaches converging on similar results and so it remains to be seen what the gold standard will be.
This lesson has been developed by members of the teaching team at the Harvard Chan Bioinformatics Core (HBC). These are open access materials distributed under the terms of the Creative Commons Attribution license (CC BY 4.0), which permits unrestricted use, distribution, and reproduction in any medium, provided the original author and source are credited.