Contributors: Meeta Mistry, Radhika Khetani
Handling replicates using the Irreproducibility Discovery Rate (IDR) framework
Another way to assess concordance of peak calls between replicates is to implement a statistical procedure. A popular method is the IDR framework developed by Qunhua Li and Peter Bickel’s group. It compares a pair of ranked lists of regions/peaks and assigns values that reflect its reproducibility.
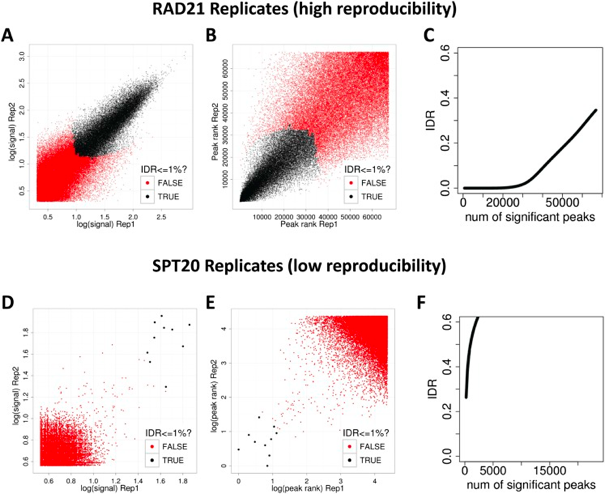
“The basic idea is that if two replicates measure the same underlying biology, the most significant peaks, which are likely to be genuine signals, are expected to have high consistency between replicates, whereas peaks with low significance, which are more likely to be noise, are expected to have low consistency. If the consistency between a pair of rank lists (peaks) that contains both significant and insignificant findings is plotted, a transition in consistency is expected (Fig. 1C). This consistency transition provides an internal indicator of the change from signal to noise and suggests how many peaks have been reliably detected.” -Excerpted from “Consistency of ChIPseq replicates: Analysis using IDR”
IDR analysis is extensively used by the ENCODE and modENCODE projects and is part of their ChIP-seq guidelines and standards. It has been established for submission of ChIP-seq data sets and have been constructed based on the historical experiences of ENCODE ChIP-seq data production groups.
Why IDR?
- IDR avoids choices of initial cutoffs, which are not comparable for different callers
- IDR does not depend on arbitrary thresholds and so all regions/peaks are considered.
- It is based on ranks, so does not require the input signals to be calibrated or with a specific fixed scale (only order matters).
Components of IDR
The IDR approach creates a curve, from which it then quantitatively assesses when the findings are no longer consistent across replicates. There are three main components:
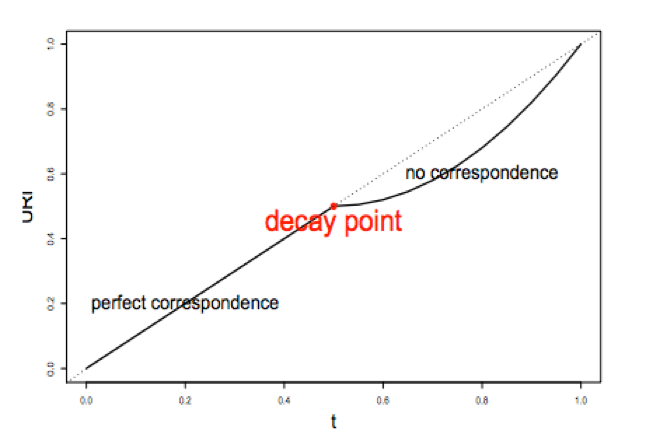
1) A correspondence curve: a graphical representation of matched peaks as you go down the ranked list. Qualitative, not adequate for selecting signals.
2) An inference procedure: summarizes the proportion of reproducible and irreproducible signals. Quantitative, using a copula mixture model.
What proportion of identifications have a poor correspondence, i.e. falling into ”noise”? How consistent are the identifications before reaching breakdown?
3) Irreproducible Discovery Rate (IDR): Derive a significance value from the inference procedure (#2) in a fashion similar to FDR, and can be used to control the level of irreproducibility rate when selecting signals. i.e. 0.05 IDR means that peak has a 5% chance of being an irreproducible discovery
The IDR pipeline
There are three main steps to the IDR pipeline:
- Evaluate peak consistency between true replicates
- Evaluate peak consistency between pooled pseudo-replicates
- Evaluate self-consistency for each individual replicate
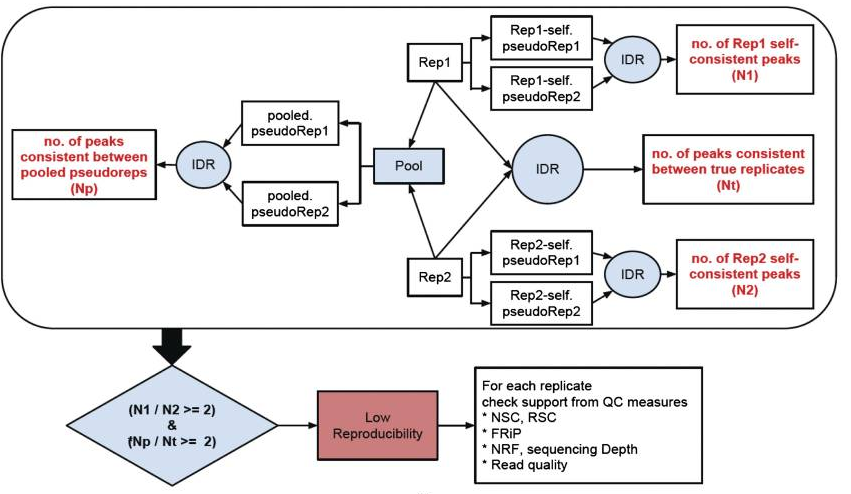
This figure is taken from the ENCODE ChIP-seq Guidelines.
Running IDR
To run IDR the recommendation is to run MACS2 less stringently. The IDR algorithm requires sampling of both signal and noise distributions to separate the peaks into two groups, so having a more liberal threshold allows us to bring in some noise. In addition the narrowPeak files have to be sorted by the -log10(p-value) column.
###DO NOT RUN THIS###

# Call peaks using a liberal p-value cutoff
macs2 callpeak -t treatFile.bam -c inputFile.bam -f BAM -g 1.3e+8 -n macs/NAME_FOR_OUPUT -B -p 1e-3  2> macs/NAME_FOR_OUTPUT_macs2.log

#Sort peak by -log10(p-value)
sort -k8,8nr NAME_OF_INPUT_peaks.narrowPeak > macs/NAME_FOR_OUPUT_peaks.narrowPeak
IDR will work with many different Peak callers, the following have been tested:
- SPP - Works out of the box
- MACS1.4 - DO NOT use with IDR
- MACS2 - Works well with IDR with occasional problems of too many ties in ranks for low quality ChIP-seq data.
- HOMER - developers have a detailed pipeline and code (in beta) for IDR analysis with HOMER at https://github.com/karmel/homer-idr
- PeakSeq - Run with modified PeakSeq parameters to obtain large number of peaks
- HotSpot, MOSAiCS, GPS/GEM, …
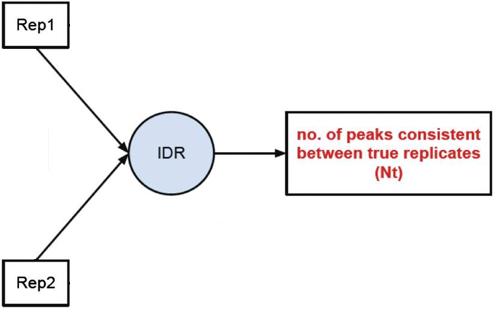
1, Peak consistency between true replicates
The first step is taking our replicates and evaluating how consistent they are with one another.
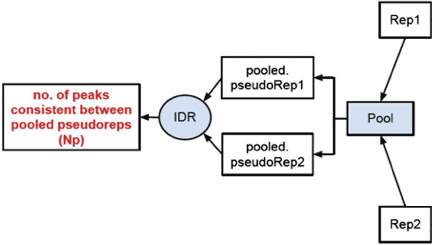
2. Peak consistency between pooled pseudoreplicates
Once you have IDR values for true replicates, you want to see how this compares to pooled replicates. This is a bit more involved, as it requires you to go back to the BAM files, merge the reads and randomly split them into two pseudo-replicates. If the original replicates are highly concordant, then shuffling and splitting them should result in pseudo-replicates that the reflect the originals. Therefore, if IDR analysis on the pooled pseudo-replicates results in a number of peaks that are similar (within a factor of 2) these are truly good replicates.
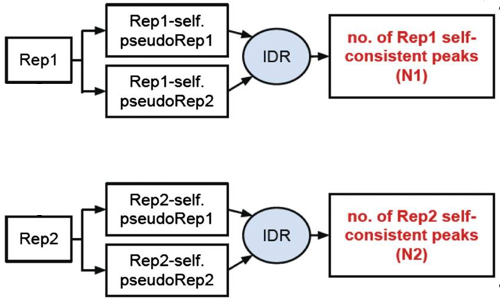
3. Self-consistency analysis
An optional step is to create pseudo-replicates for each replicate by randomly splitting the reads and running them through the same workflow. Again, if IDR analysis on the self-replicates for Replicate 1 results in a number of peaks that are similar (within a factor of 2) to self-replicates for Replicate 2 these are truly good replicates.
Threshold guidelines
The user manual provides guidelines on IDR thresholds which are recommended for the different types of IDR analyses. Depending on the organism you are studying and the total number of peaks you are starting with you will want to modify the thresholds accordingly.
This lesson has been developed by members of the teaching team at the Harvard Chan Bioinformatics Core (HBC). These are open access materials distributed under the terms of the Creative Commons Attribution license (CC BY 4.0), which permits unrestricted use, distribution, and reproduction in any medium, provided the original author and source are credited.