Cluster QC Exercise Answer Key
B cell markers
FeaturePlot(seurat_integrated,
            reduction = "umap",
            features = c("CD79A", "MS4A1"),
            sort.cell = TRUE,
            min.cutoff = 'q10',
            label = TRUE)
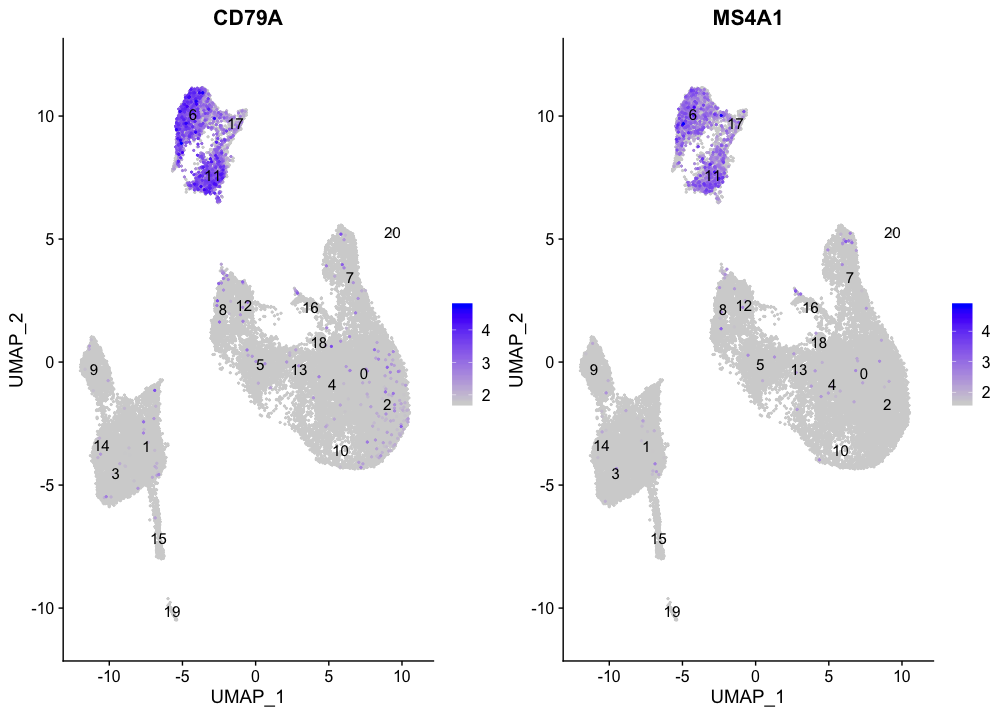
Clusters 6, 11, and 17 have good expression of the B cell markers. This corresponds to the hypothesized identity based on the genes driving PC2.
T cell markers
FeaturePlot(seurat_integrated,
            reduction = "umap",
            features = c("CD3D"),
            sort.cell = TRUE,
            min.cutoff = 'q10',
            label = TRUE)
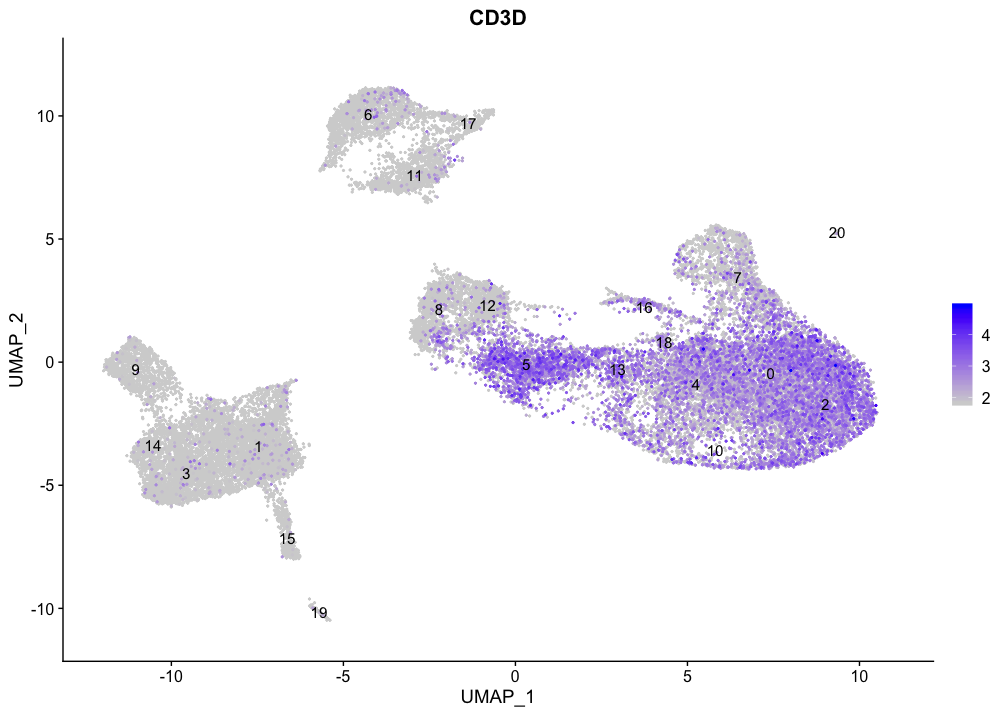
All T cells markers concentrate in the large group of clusters on the right-hand side of the plot, with the exception of clusters 7, 8, 12, and 16.
CD4+ T cell markers
FeaturePlot(seurat_integrated,
            reduction = "umap",
            features = c("CD3D", "IL7R", "CCR7"),
            sort.cell = TRUE,
            min.cutoff = 'q10',
            label = TRUE)
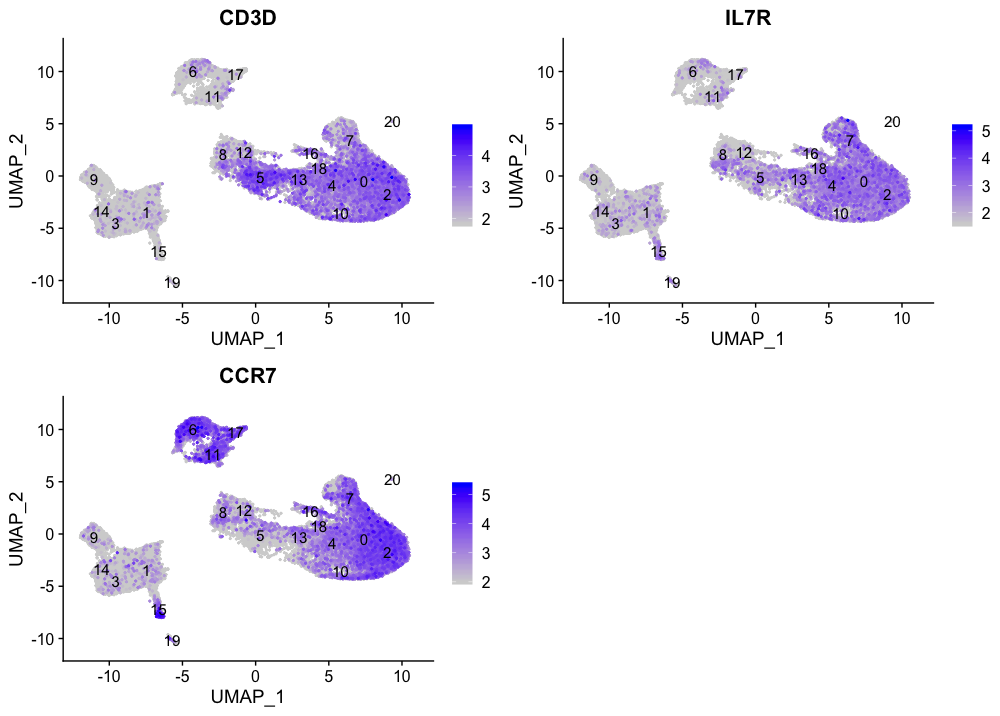
The subset of T cells corresponding to the CD4+ T cells are clusters 0, 2, 4, 10, and 18. We see expression in other clusters, as well, but these weren’t expressing high levels of the T cell marker CD3D.
CD8+ T cell markers
FeaturePlot(seurat_integrated,
            reduction = "umap",
            features = c("CD3D", "CD8A"),
            sort.cell = TRUE,
            min.cutoff = 'q10',
            label = TRUE)
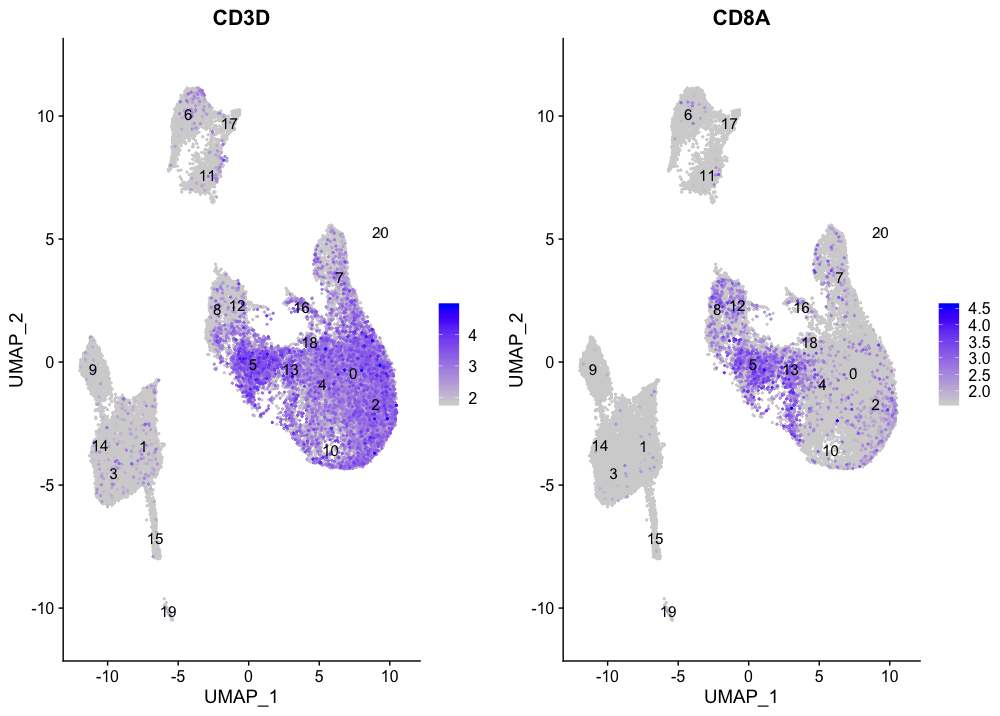
For CD8+ T cells the only consistent expression for both markers is observed for clusters 5 and 13.
NK cell markers
FeaturePlot(seurat_integrated,
            reduction = "umap",
            features = c("GNLY", "NKG7"),
            sort.cell = TRUE,
            min.cutoff = 'q10',
            label = TRUE)
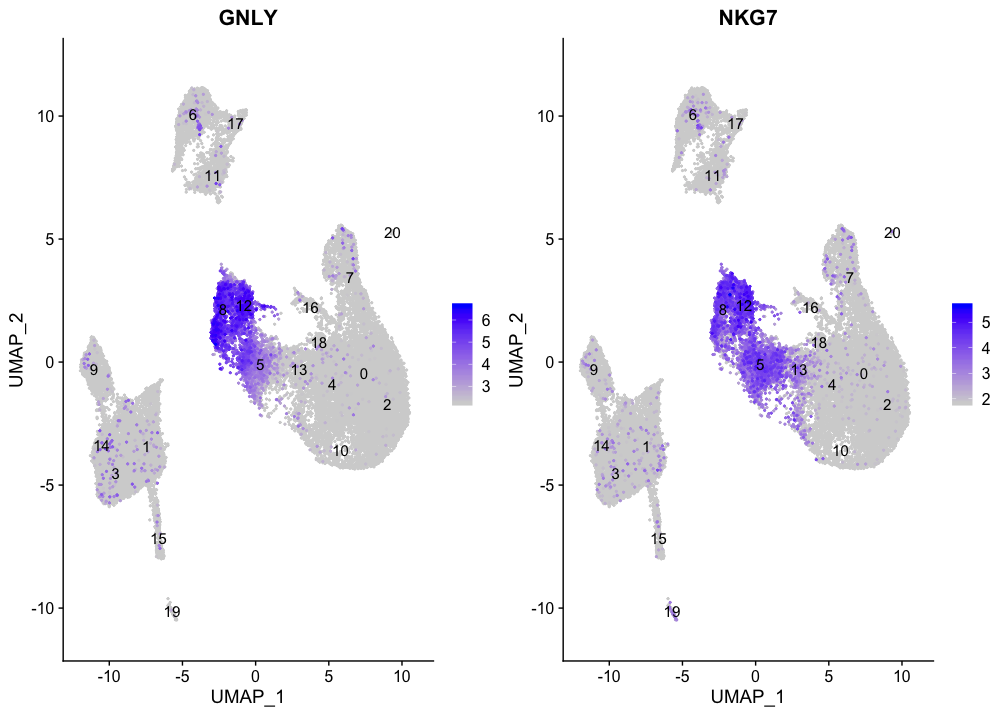
The NK cell markers are expressed in clusters 8 and 12, in addition to cluster 5; however, we know cluster 5 expresses T cell markers. We would hypothesize that cluster 5 may be an activated CD8+ T cell.
Megakaryocyte markers
FeaturePlot(seurat_integrated,
            reduction = "umap",
            features = c("PPBP"),
            sort.cell = TRUE,
            min.cutoff = 'q10',
            label = TRUE)
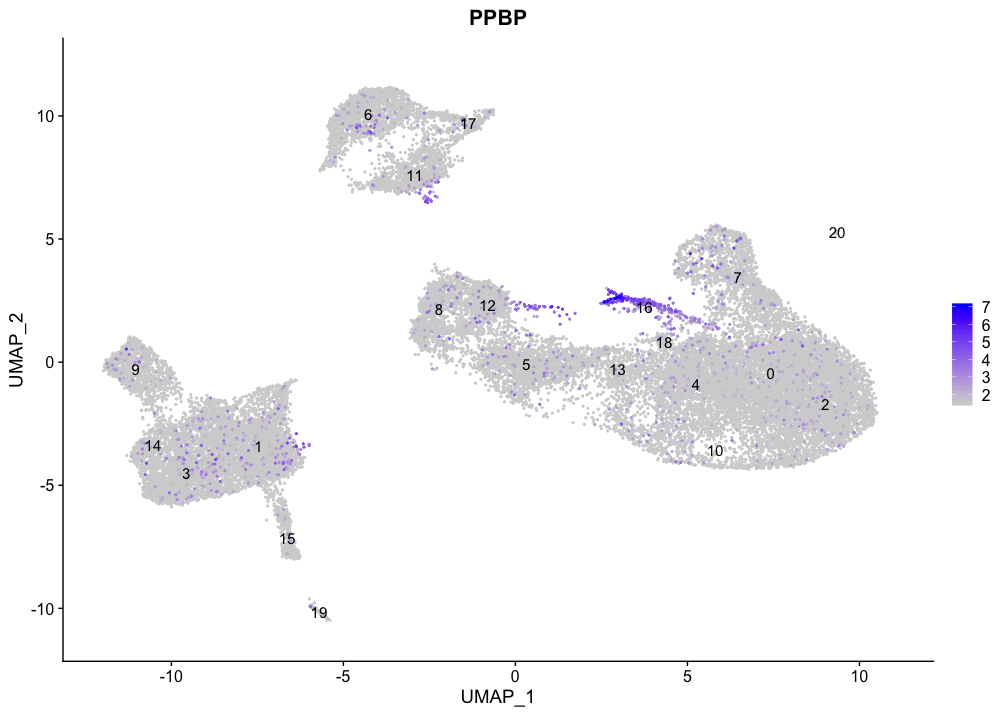
The megakaryocyte markers seem to be expressed mainly in cluster 16.
Erythrocyte markers
FeaturePlot(seurat_integrated,
            reduction = "umap",
            features = c("HBB", "HBA2"),
            sort.cell = TRUE,
            min.cutoff = 'q10',
            label = TRUE)
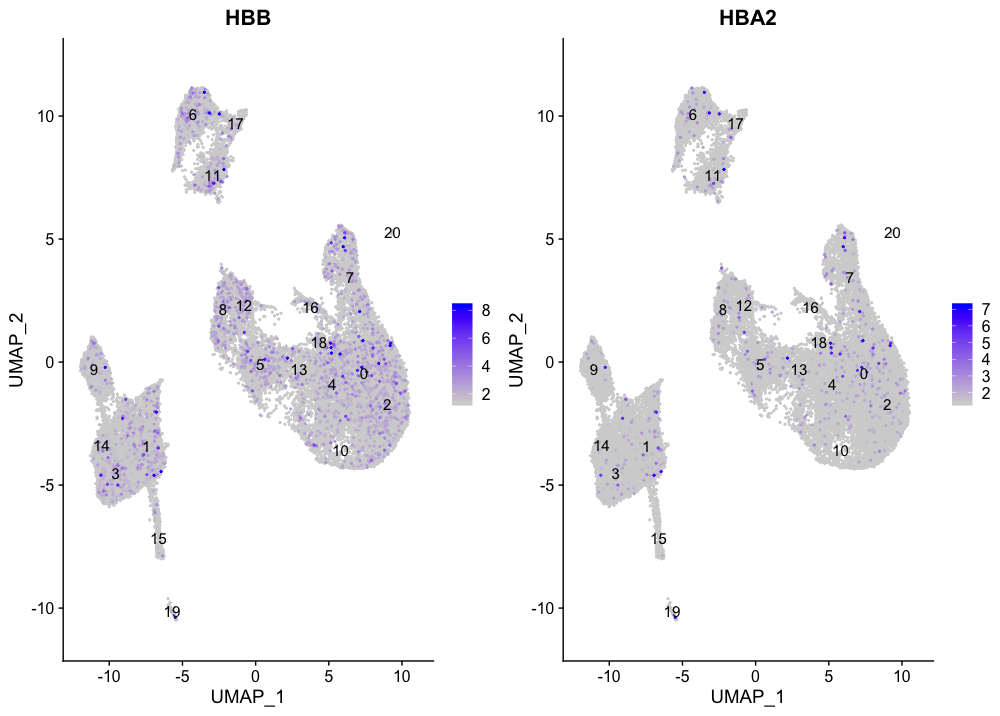
There does not seem to be a cluster of erythrocytes, as the markers are spread around the different cell types. This is not a bad thing as the blood cells are often cell types to be excluded from the analysis, since they are not often informative about the condition of interest.
Based on these results, we can associate clusters with the cell types. However, we would like to perform a deeper analysis using marker identification before performing a final assignment of the clusters to a cell type.
| Cell Type | Clusters |
|---|---|
| CD14+ monocytes | 1, 3, 14 |
| FCGR3A+ monocytes | 9 |
| Conventional dendritic cells | 15 |
| Plasmacytoid dendritic cells | 19 |
| B cells | 6, 11, 17 |
| T cells | 0, 2, 4, 5, 10, 13, 18 |
| CD4+ T cells | 0, 2, 4, 10, 18 |
| CD8+ T cells | 5, 13 |
| NK cells | 8, 12 |
| Megakaryocytes | 16 |
| Erythrocytes | - |
| Unknown | 7, 20 |