FeaturePlot(seurat_integrated,
            reduction = "umap",
            features = c("CD79A", "MS4A1"),
            order = TRUE,
            min.cutoff = 'q10',
            label = TRUE)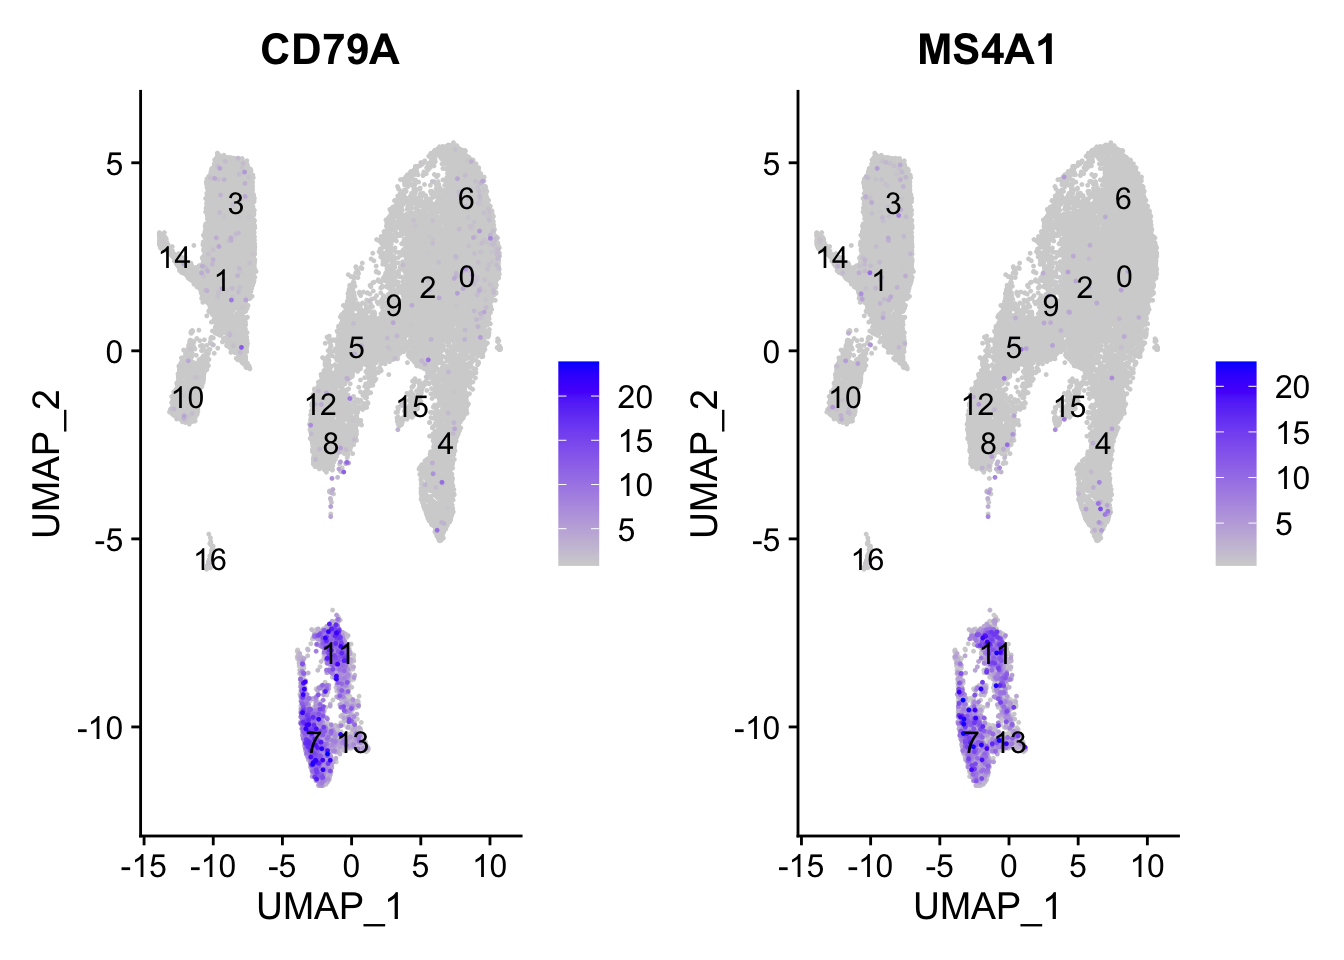
Hypothesize the clusters corresponding to each of the different clusters in the table:
| Cell Type | Clusters |
|---|---|
| CD14+ monocytes | 1, 3 |
| FCGR3A+ monocytes | 10 |
| Conventional dendritic cells | 14 |
| Plasmacytoid dendritic cells | 16 |
| Marcrophages | - |
| B cells | ? |
| T cells | ? |
| CD4+ T cells | ? |
| CD8+ T cells | ? |
| NK cells | ? |
| Megakaryocytes | ? |
| Erythrocytes | ? |
| Unknown | ? |
FeaturePlot(seurat_integrated,
reduction = "umap",
features = c("CD79A", "MS4A1"),
order = TRUE,
min.cutoff = 'q10',
label = TRUE)
B cells appear to be clusters 7, 11 and 13.
FeaturePlot(seurat_integrated,
            reduction = "umap",
            features = c("CD3D"),
            order = TRUE,
            min.cutoff = 'q10',
            label = TRUE)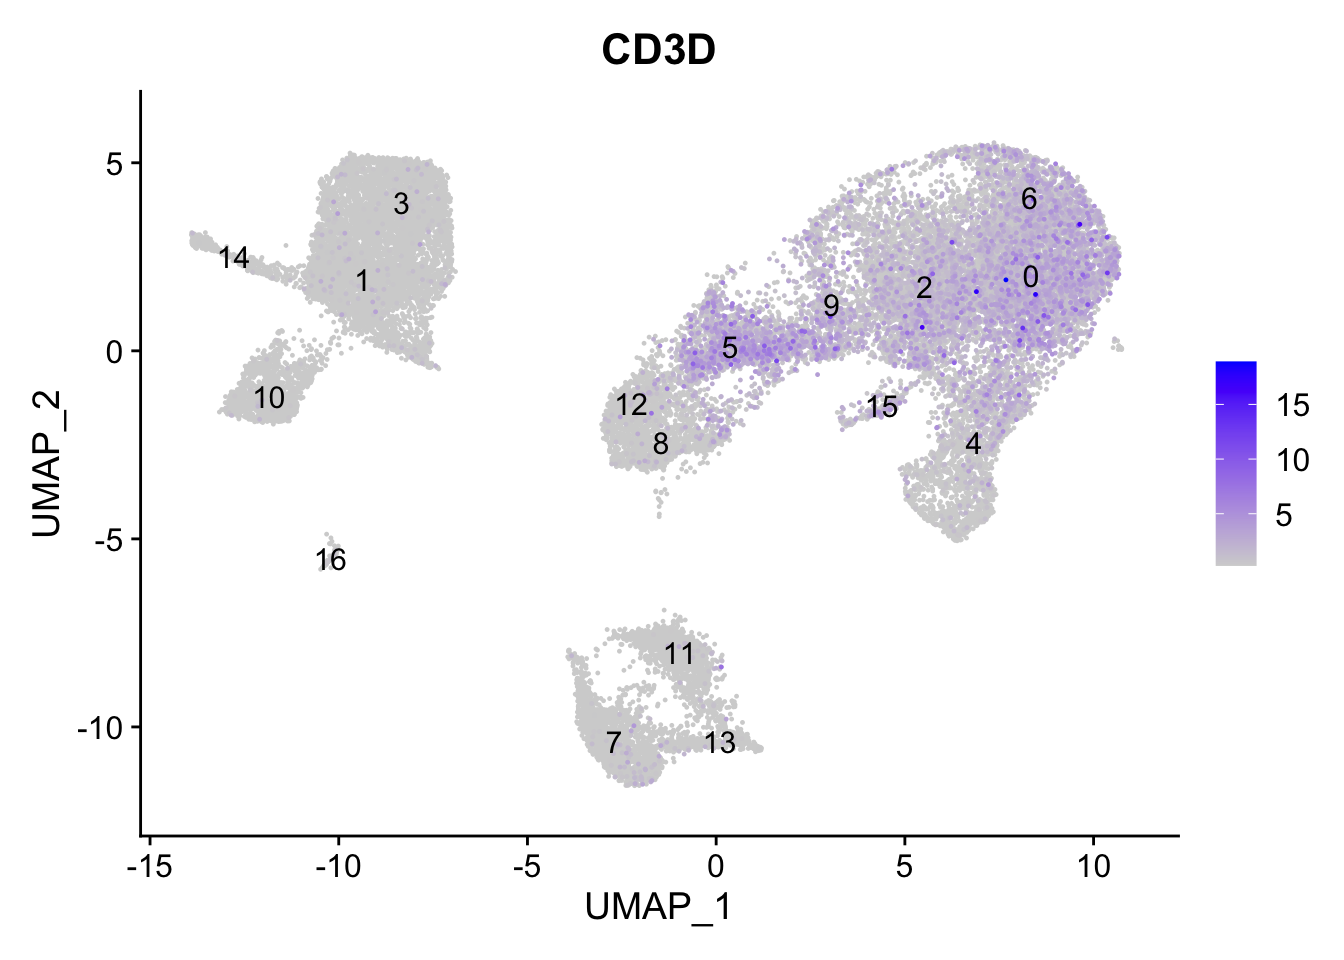
T cells appear to be clusters 0, 2, 4, 5, 6 and 9.
FeaturePlot(seurat_integrated,
            reduction = "umap",
            features = c("CD3D", "IL7R", "CCR7"),
            order = TRUE,
            min.cutoff = 'q10',
            label = TRUE)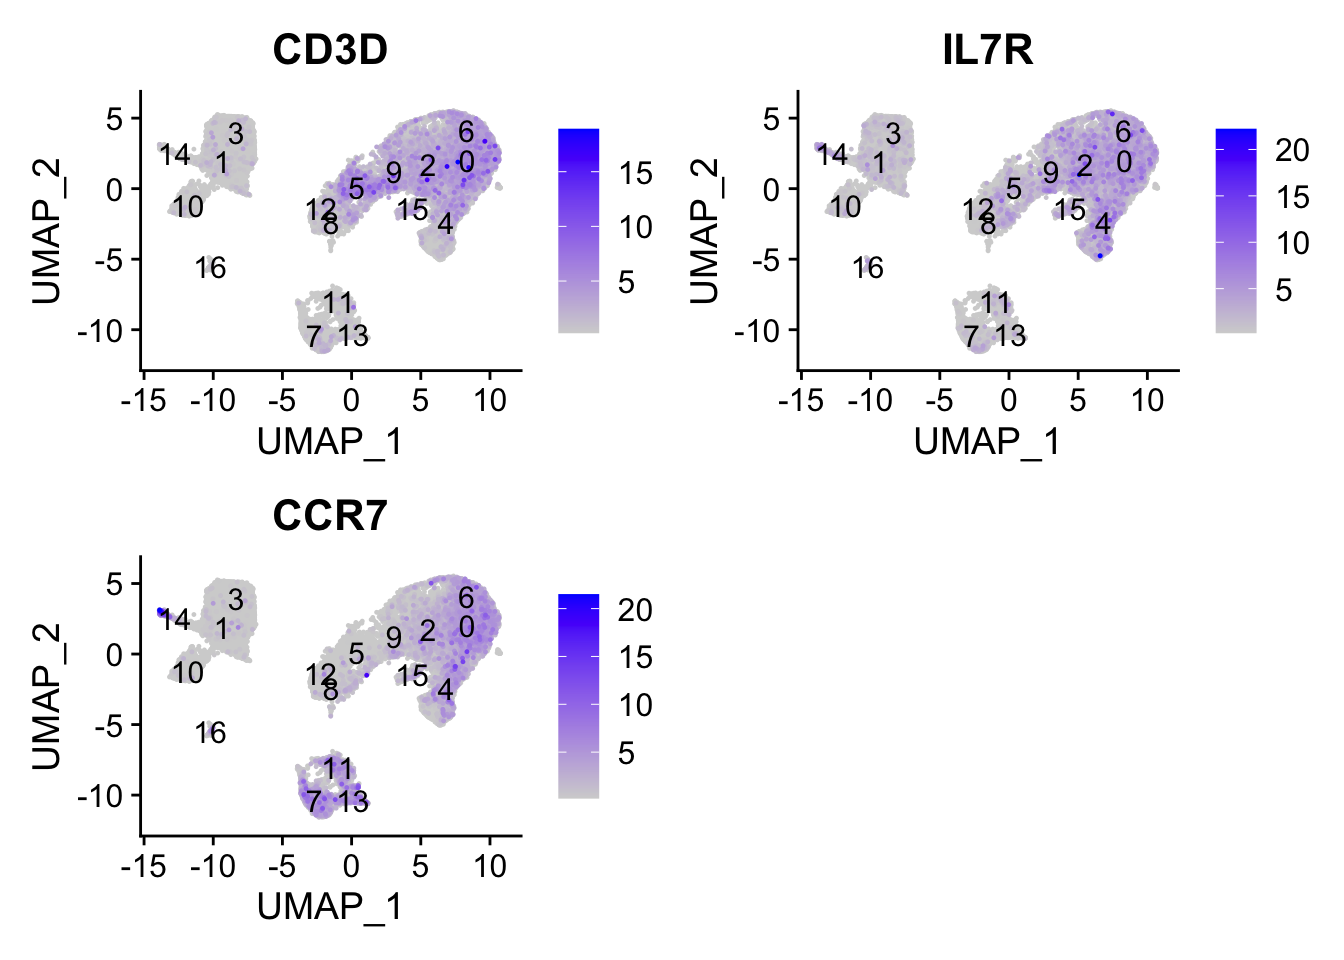
CD4+ T cells appear to be clusters 0, 2, 4 and 6.
FeaturePlot(seurat_integrated,
            reduction = "umap",
            features = c("CD3D", "CD8A"),
            order = TRUE,
            min.cutoff = 'q10',
            label = TRUE)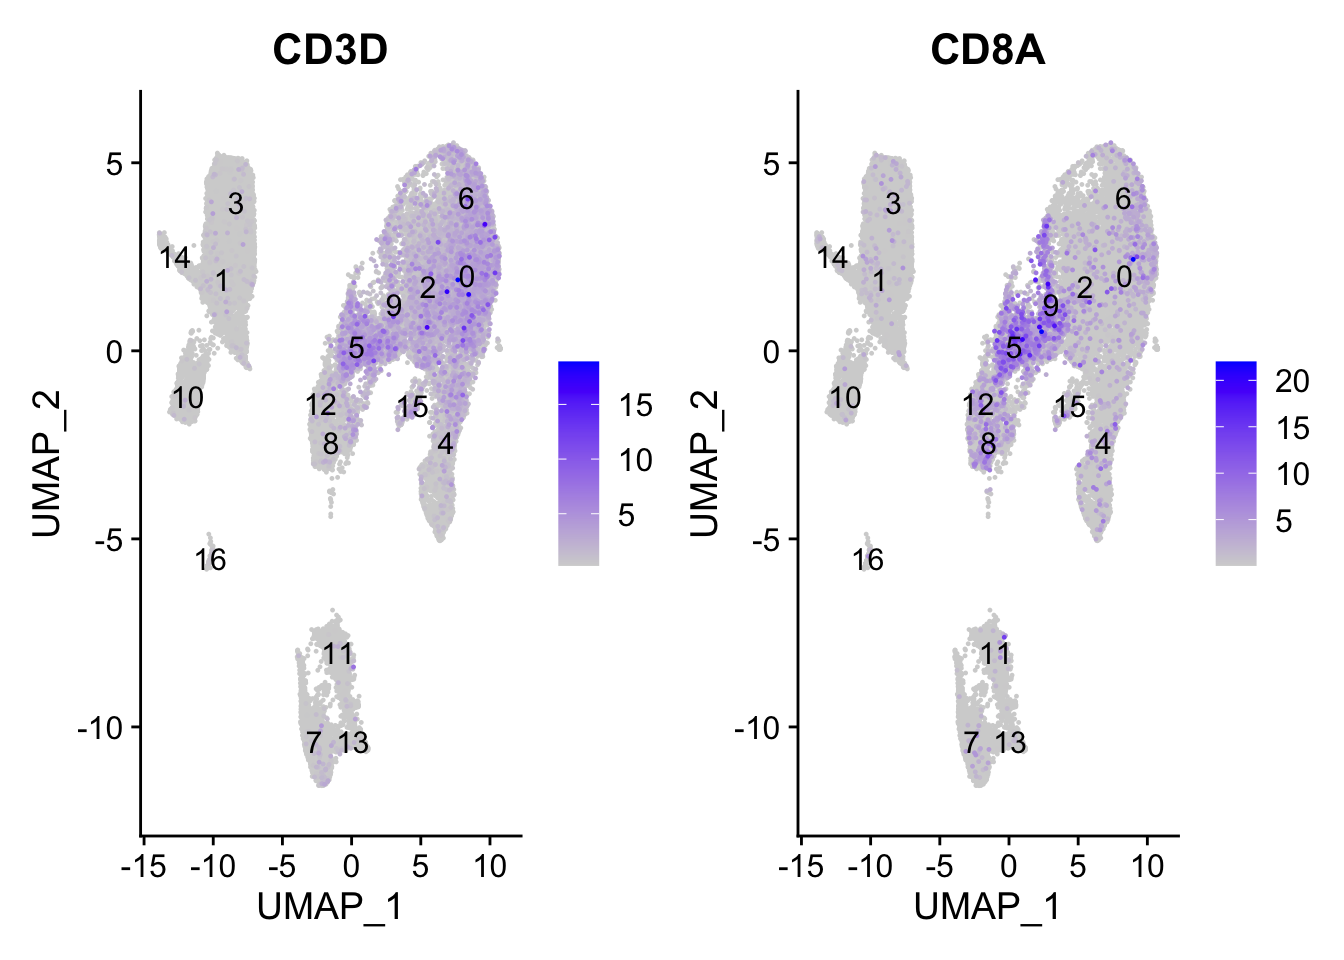
CD8+ T cells appear to be clusters 5 and 9.
FeaturePlot(seurat_integrated,
            reduction = "umap",
            features = c("GNLY", "NKG7"),
            order = TRUE,
            min.cutoff = 'q10',
            label = TRUE)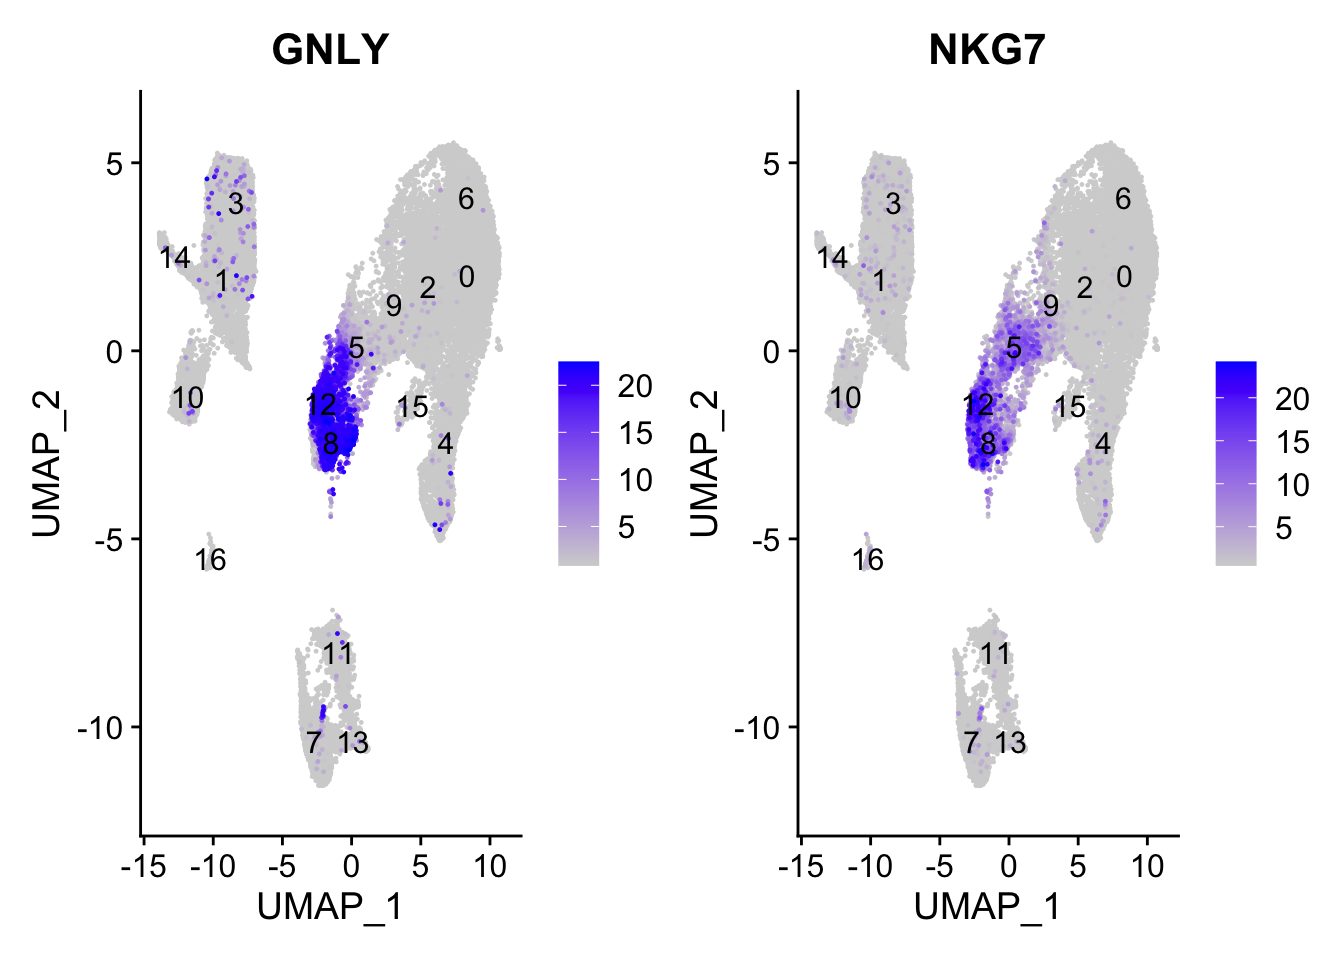
NK cells appear to be clusters 8 and 12.
FeaturePlot(seurat_integrated,
            reduction = "umap",
            features = c("PPBP"),
            order = TRUE,
            min.cutoff = 'q10',
            label = TRUE)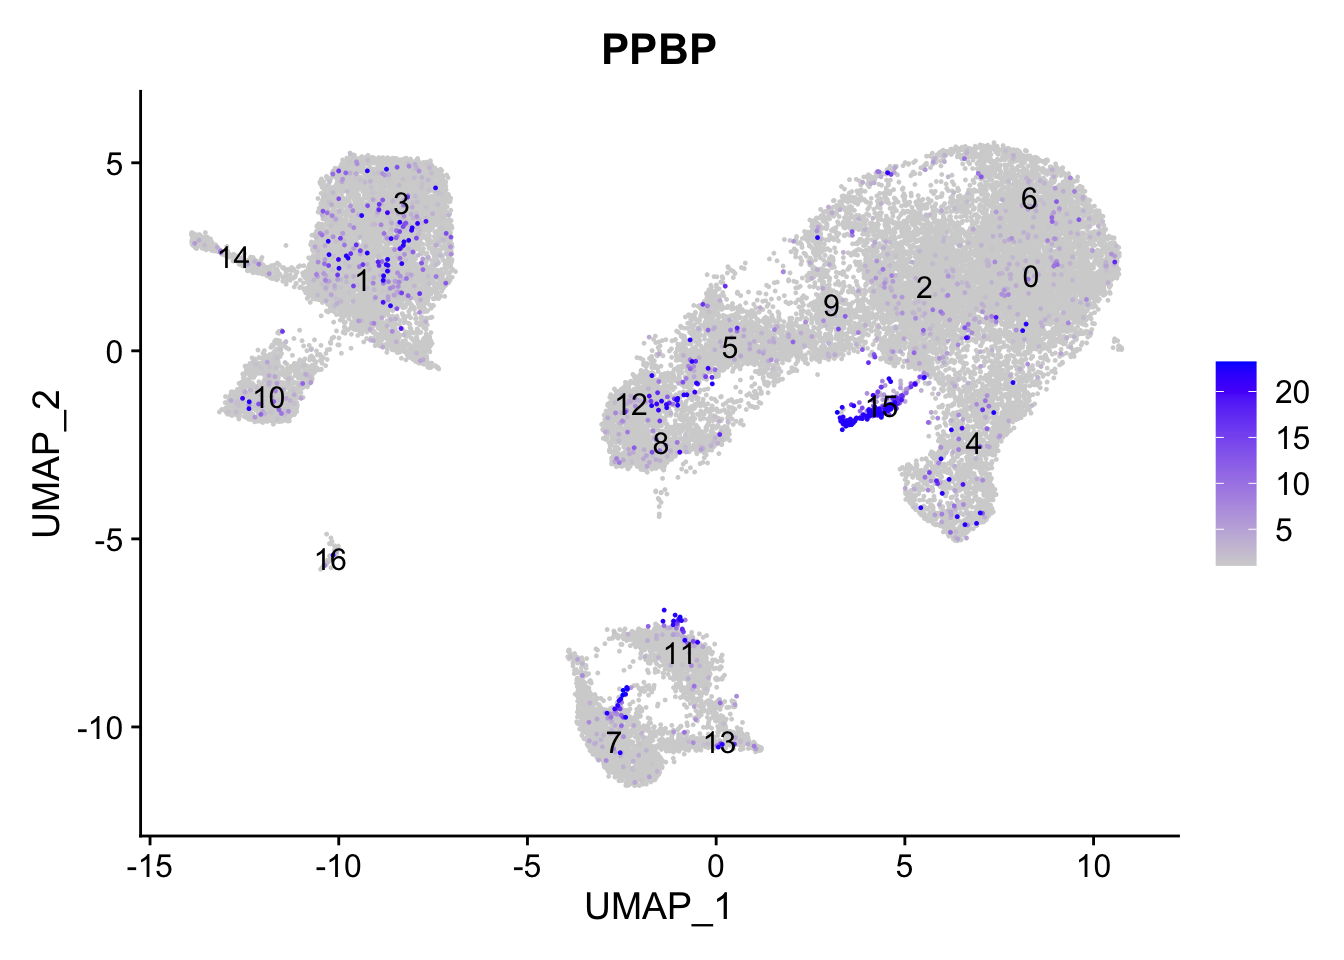
Megakaryocytes appear to be clusters 15.
FeaturePlot(seurat_integrated,
            reduction = "umap",
            features = c("HBB", "HBA2"),
            order = TRUE,
            min.cutoff = 'q10',
            label = TRUE)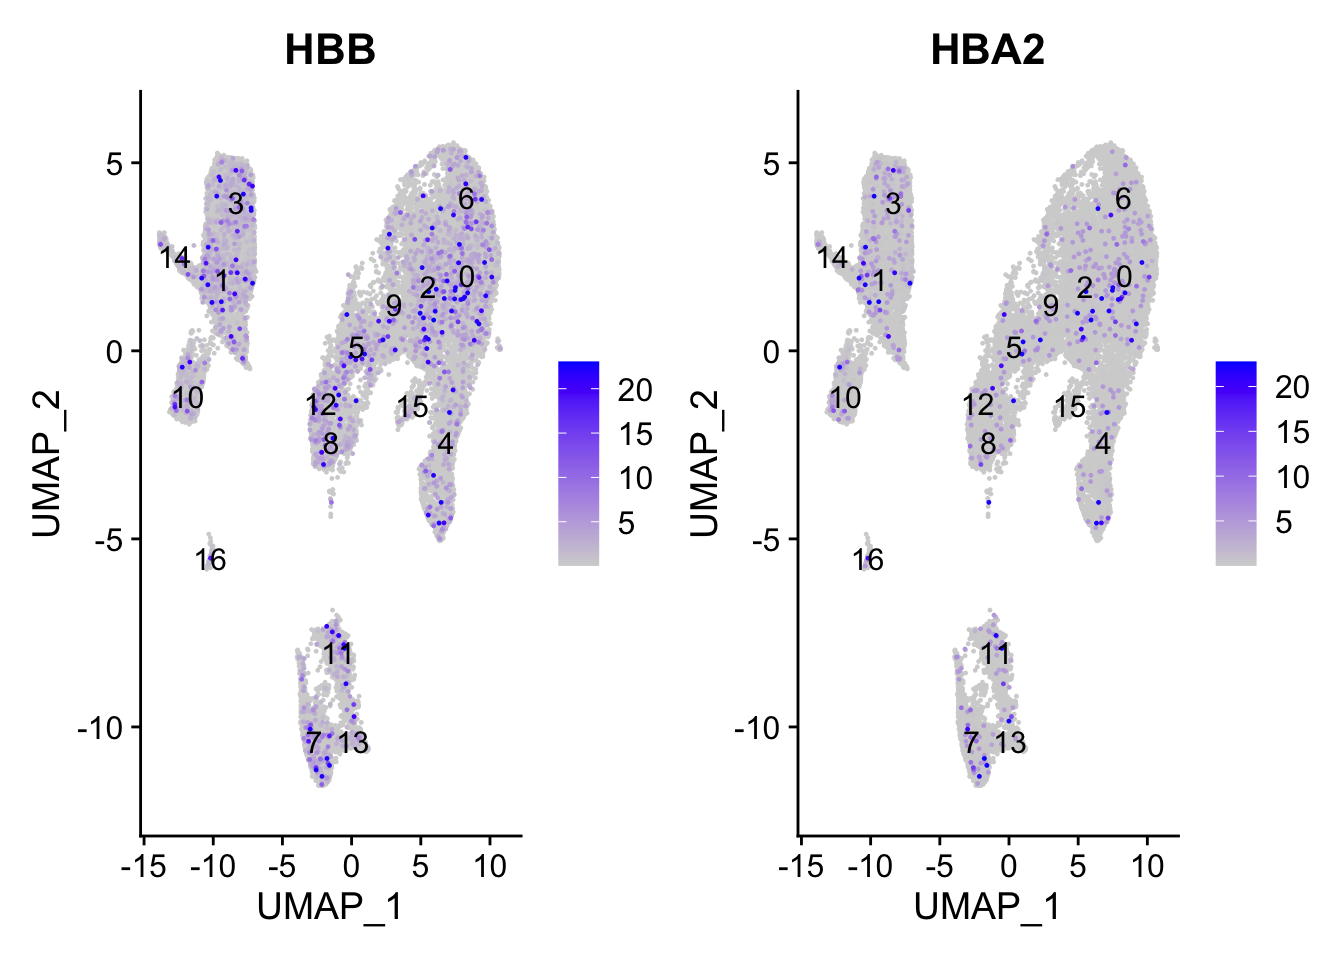
Erythrocytes don’t appear to be present.
| Cell Type | Clusters |
|---|---|
| CD14+ monocytes | 1, 3 |
| FCGR3A+ monocytes | 10 |
| Conventional dendritic cells | 14 |
| Plasmacytoid dendritic cells | 16 |
| Marcrophages | - |
| B cells | 7, 11, 13 |
| T cells | 0, 2, 4, 5, 6, 9 |
| CD4+ T cells | 0, 2, 4, 6 |
| CD8+ T cells | 5, 9 |
| NK cells | 8, 12 |
| Megakaryocytes | 15 |
| Erythrocytes | - |