#Assign identity of clusters
Idents(object = seurat_integrated) <- "integrated_snn_res.0.4"

# Plot the UMAP
DimPlot(seurat_integrated,
        reduction = "umap",
        label = TRUE,
        label.size = 6)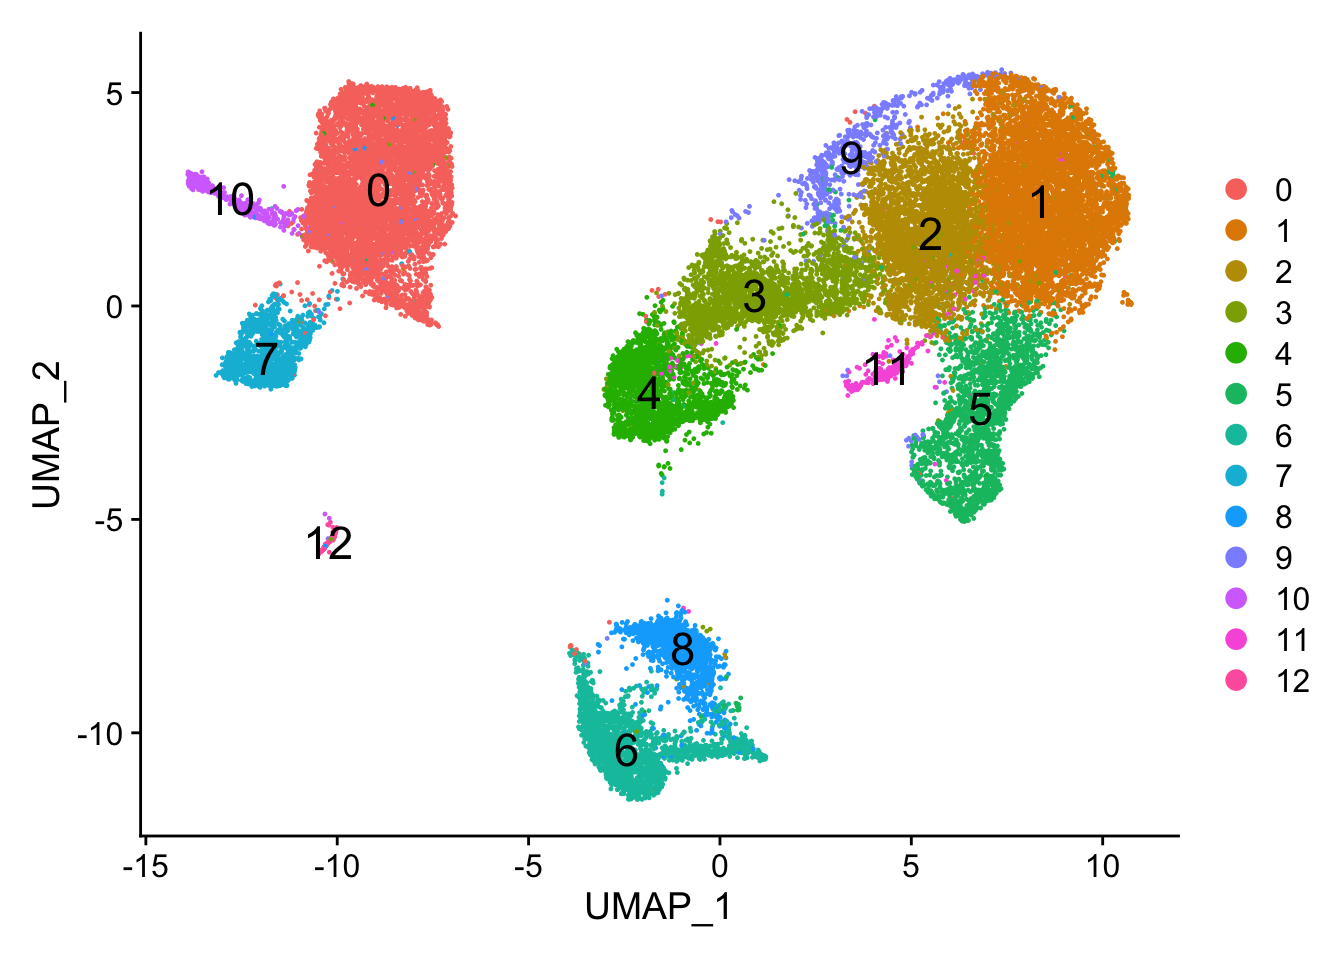
After loading seurat_integrated.RData.bz2, check the object clusters with different resolution (0.4, 0.6, 0.8, 1, 1.4). For each resolution plot the corresponding UMAP and report how many clusters you observe. Which resolution do you think makes sense?
We can count the number of clusters from the DimPlot() (remember that it is zero-indexed).
#Assign identity of clusters
Idents(object = seurat_integrated) <- "integrated_snn_res.0.4"
# Plot the UMAP
DimPlot(seurat_integrated,
reduction = "umap",
label = TRUE,
label.size = 6)
Alternatively, we can retrieve the number of clusters using this command:
# Retrieve the number of clusters in integrated_snn_res.0.4
length(unique(seurat_integrated$integrated_snn_res.0.4))
[1] 13# Retrieve the number of clusters in integrated_snn_res.0.6
length(unique(seurat_integrated$integrated_snn_res.0.6))[1] 15# Retrieve the number of clusters in integrated_snn_res.0.8
length(unique(seurat_integrated$integrated_snn_res.0.8))[1] 17# Retrieve the number of clusters in integrated_snn_res.1
length(unique(seurat_integrated$integrated_snn_res.1))[1] 22# Retrieve the number of clusters in integrated_snn_res.1.4
length(unique(seurat_integrated$integrated_snn_res.1.4))[1] 27