Day 4 Activities
-
Change the
animalsdata frame to a tibble calledanimals_tb. Save the row names to a column calledanimal_namesbefore turning it into a tibble.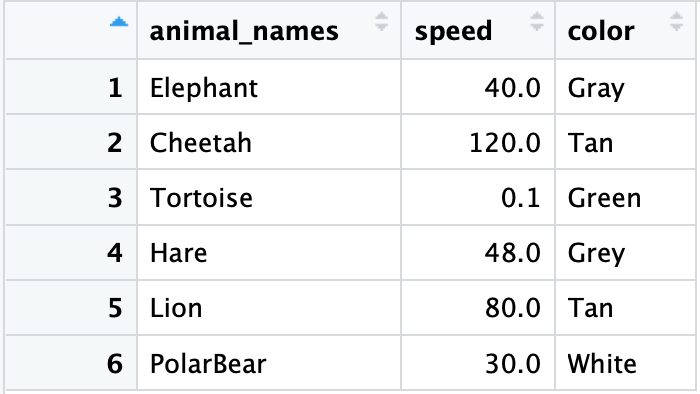
-
Use ggplot2 to plot the animal names (x-axis) versus the speed of the animal (y-axis) in
animals_tbusing a scatterplot. Customize the plot to display as shown below.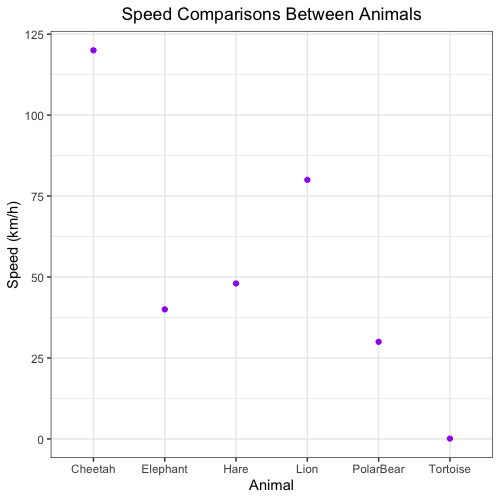
-
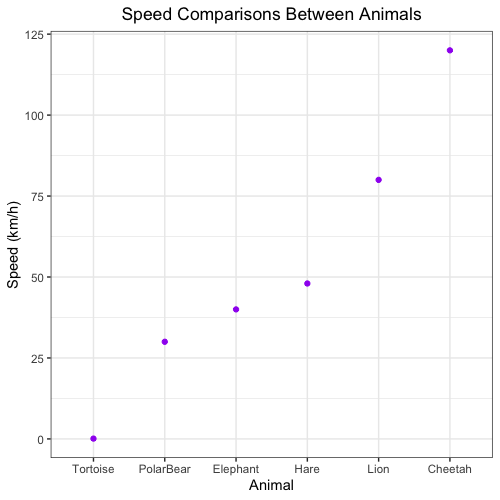
We decide that our plot would look better with the animal names ordered from slowest to fastest. Using the
animals_tbtibble, reorder the animals on the x-axis to start with the slowest animal on the left-hand side of the plot to the fastest animal on the right-hand side of the plot by completing the following steps:a. Use the
arrange()function to order the rows by speed from slowest to fastest. Then use thepull()function to extract theanimal_namescolumn as a vector of character values. Save the new variable asnames_ordered_by_speed.b. Turn the
animal_namescolumn ofanimals_tbinto a factor and specify the levels asnames_ordered_by_speedfrom slowest to fastest (output in part a). Note: this step is crucial, because ggplot2 usesfactoras plotting order, instead of the order we observe in data frame.c. Re-plot the scatterplot with the animal names in order from slowest to fastest.
Note: If you are interested in exploring other ways to reorder a variable in ggplot2, refer to this post.
-
Save the plot as a PDF called
animals_by_speed_scatterplot.pdfto theresultsfolder. -
Use the functions from the
dplyrpackage to perform the following tasks:a. Extract the rows of
animals_tbtibble with color of gray or tan, order the rows based from slowest to fastest speed, and save to a variable calledanimals_gray_tan.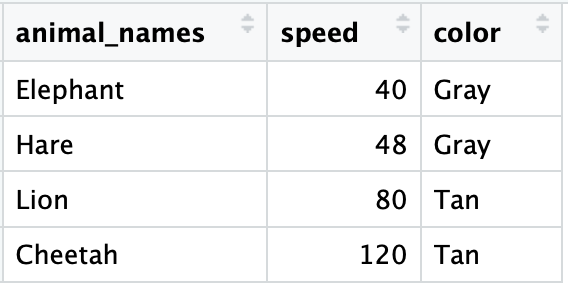
b. Save
animals_gray_tanas a comma-separated value file calledanimals_tb_ordered.csvto theresultsfolder.