QC methods for DE analysis using DESeq2 - Answer key
Exercise 1
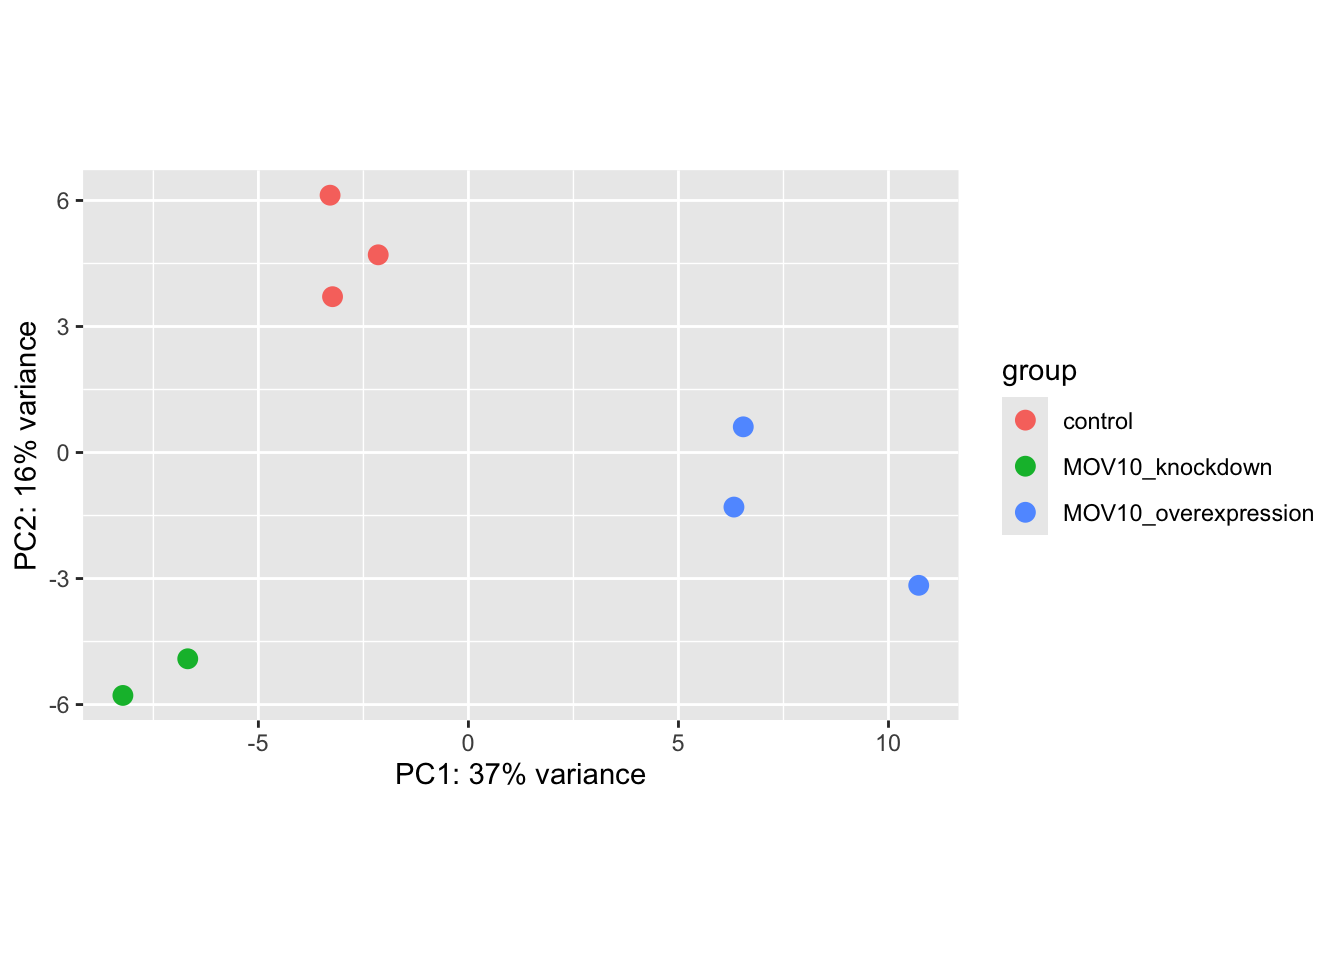
What does the above plot tell you about the similarity of samples?
Samples from different experimental groups are different, while replicates within the same group are similar.
Does it fit the expectation from the experimental design?
Yes, it does.
What do you think the %variance information (in the axes titles) tell you about the data in the context of the PCA?
PC1 is associated with 37% of the variance in the data, and PC2 is associated with 16%.
Note
You won’t see the %variance information when you make PCA plots without the plotPCA() function. But there are tools that let you explore this.