SPIA
The SPIA (Signaling Pathway Impact Analysis) tool can be used to integrate the lists of differentially expressed genes, their fold changes, and pathway topology to identify affected pathways. The blog post from Getting Genetics Done provides a step-by-step procedure for using and understanding SPIA.
# Set-up

BiocManager::install("SPIA")
library(SPIA)

## Significant genes is a vector of fold changes where the names are ENTREZ gene IDs. The background set is a vector of all the genes represented on the platform.

background_entrez <- res_entrez$entrezid

sig_res_entrez <- res_entrez[which(res_entrez$padj < 0.05), ]

sig_entrez <- sig_res_entrez$log2FoldChange

names(sig_entrez) <- sig_res_entrez$entrezid

head(sig_entrez)
Now that we have our background and significant genes in the appropriate format, we can run SPIA:
spia_result <- spia(de=sig_entrez, all=background_entrez, organism="hsa")

head(spia_result, n=20)
SPIA outputs a table showing significantly dysregulated pathways based on over-representation and signaling perturbations accumulation. The table shows the following information:
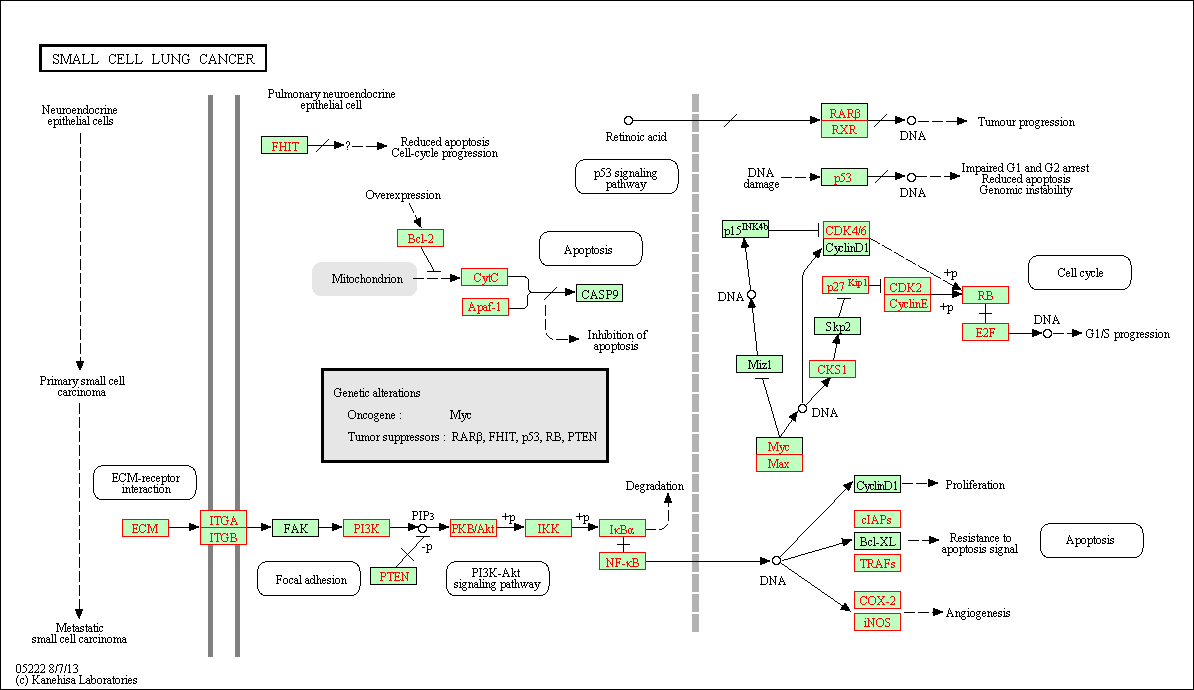
pSize: the number of genes on the pathwayNDE: the number of DE genes per pathwaytA: the observed total perturbation accumulation in the pathwaypNDE: the probability to observe at least NDE genes on the pathway using a hypergeometric model (similar to ORA)pPERT: the probability to observe a total accumulation more extreme than tA only by chancepG: the p-value obtained by combining pNDE and pPERTpGFdrandpGFWERare the False Discovery Rate and Bonferroni adjusted global p-values, respectivelyStatus: gives the direction in which the pathway is perturbed (activated or inhibited)KEGGLINKgives a web link to the KEGG website that displays the pathway image with the differentially expressed genes highlighted in red
We can view the significantly dysregulated pathways by viewing the over-representation and perturbations for each pathway.
plotP(spia_result, threshold=0.05)
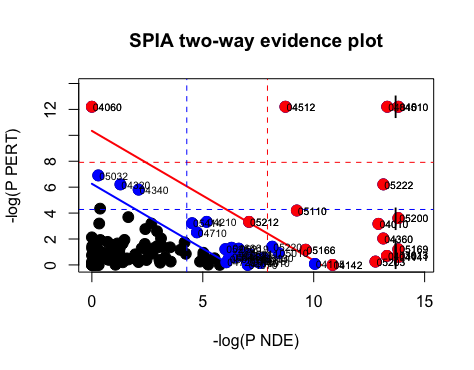
In this plot, each pathway is a point and the coordinates are the log of pNDE (using a hypergeometric model) and the p-value from perturbations, pPERT. The oblique lines in the plot show the significance regions based on the combined evidence.
If we choose to explore the significant genes from our dataset occurring in these pathways, we can subset our SPIA results:
## Look at pathway 03013 and view kegglink
subset(spia_result, ID == "03013")
Then, click on the KEGGLINK, we can view the genes within our dataset from these perturbed pathways: