Functional analysis
The output of RNA-seq differential expression analysis is a list of significant differentially expressed genes (DEGs). To gain greater biological insight on the differentially expressed genes there are various analyses that can be done:
- determine whether there is enrichment of known biological functions, interactions, or pathways
- group genes with similar trends to identify novel pathways/networks
While tools for functional analysis span a wide variety of techniques, they can loosely be categorized into three main types:
- over-representation analysis
- functional class scoring
- pathway topology
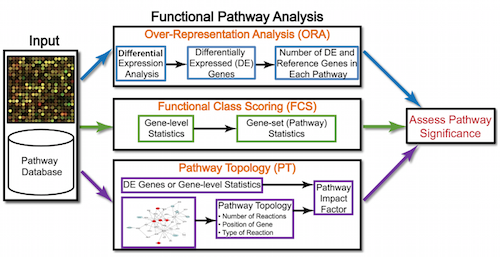
Note Functional Analysis should NOT be used to make final conclusions, instead use the output as a starting point for designing validation experiments.
Over-representation analysis
There are many databases that categorize genes into groups based on:
- shared function
- involvement in a pathway
- presence in a specific cellular location
- other categorizations, e.g. functional pathways, etc.
These categories are given consistent names (controlled vocabulary) and are independent of species, however some species may have distinct categories available.
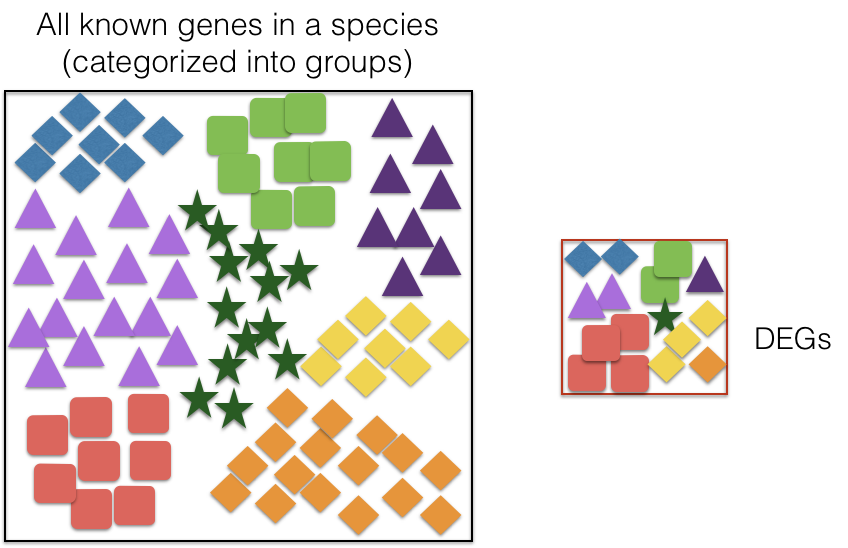
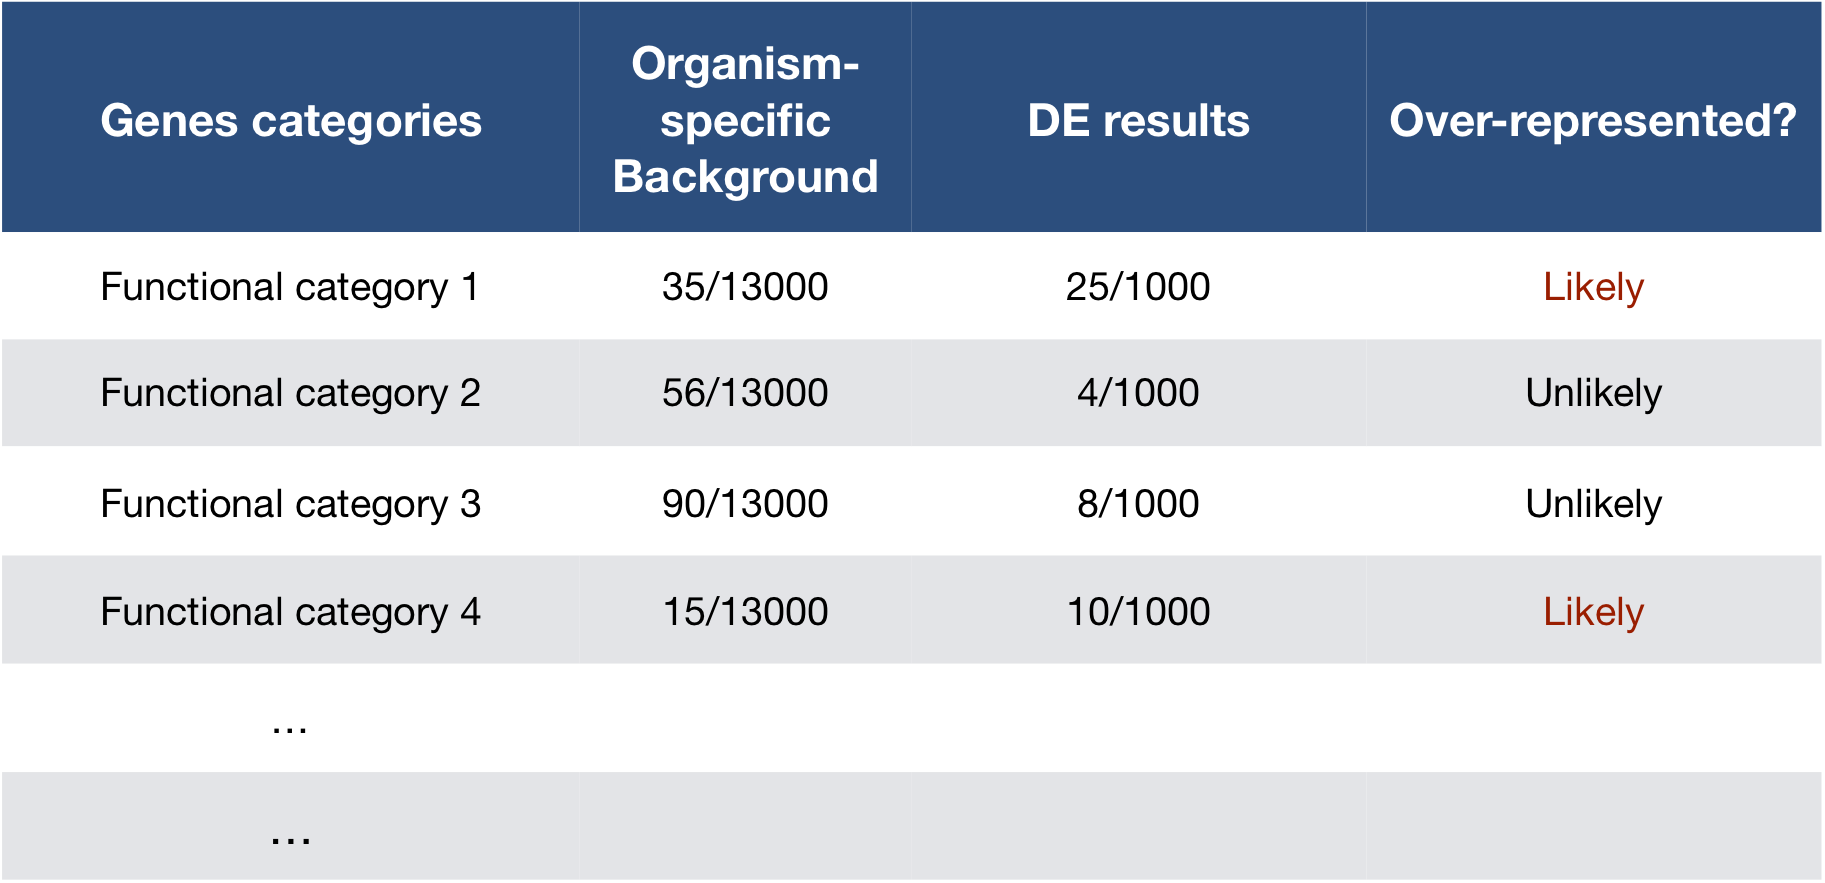
The idea is to check if your gene list of interest has an over-representation of genes from one or more category. You can determine the probability of having the observed proportion of genes associated with a specific category in your gene list based on the proportion of genes associated with the same category in the background set.
Hypergeometric testing
The common test applied for this type of comparison of proportions is the Hypergeometric test.
Using the example of the first functional category above, hypergeometric distribution is a probability distribution that describes the probability of 25 genes (k) being associated with “Functional category 1”, for all genes in our gene list (n=1000), from a population of all of the genes in entire genome (N=13,000) which contains 35 genes (K) associated with “Functional category 1” [2].
The calculation of probability of k successes follows the formula:

This test will result in a p-value for each category tested. Most tools will perform multiple test correction and also output the adjusted p-value.
The Gene Ontology (GO) project
One of the most widely-used categorizations is GO or Gene Ontology established by the Gene Ontology project.
GO categorizations
To describe the roles of genes and gene products, GO terms are organized into three independent controlled vocabularies (ontologies) in a species-independent manner:
- Biological process: refers to the biological role involving the gene or gene product, and could include “transcription”, “signal transduction”, and “apoptosis”. A biological process generally involves a chemical or physical change of the starting material or input.
- Molecular function: represents the biochemical activity of the gene product, such activities could include “ligand”, “GTPase”, and “transporter”.
- Cellular component: refers to the location in the cell of the gene product. Cellular components could include “nucleus”, “lysosome”, and “plasma membrane”.
Some features of GO categories:
- Each GO term has a term name (e.g. DNA repair) and a unique term accession ID (GO:0005125)
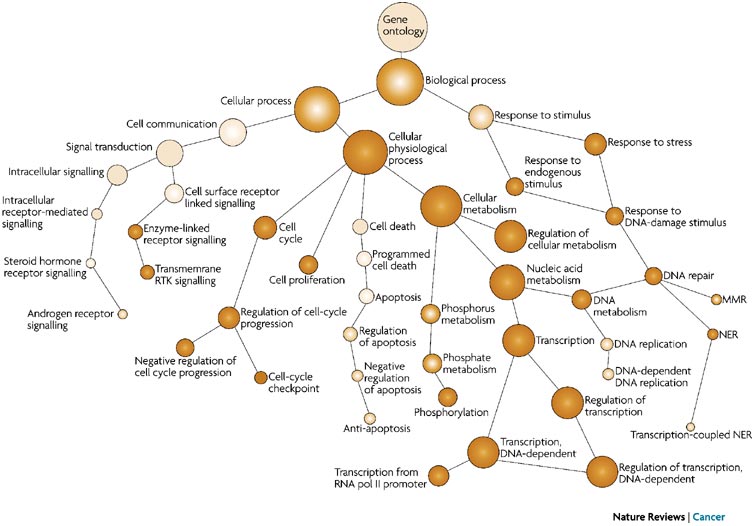
- GO terms are hierarchical in nature and some terms may have more than one parent term
- A single gene may be associated with many GO terms
- Some genes may not have any categorization, if their function or localization is unknown; i.e. not all genes are meaningfully represented
- Depending on what level you choose you can have many or fewer categories
Tips for working with GO terms
Visualizing over-representation results
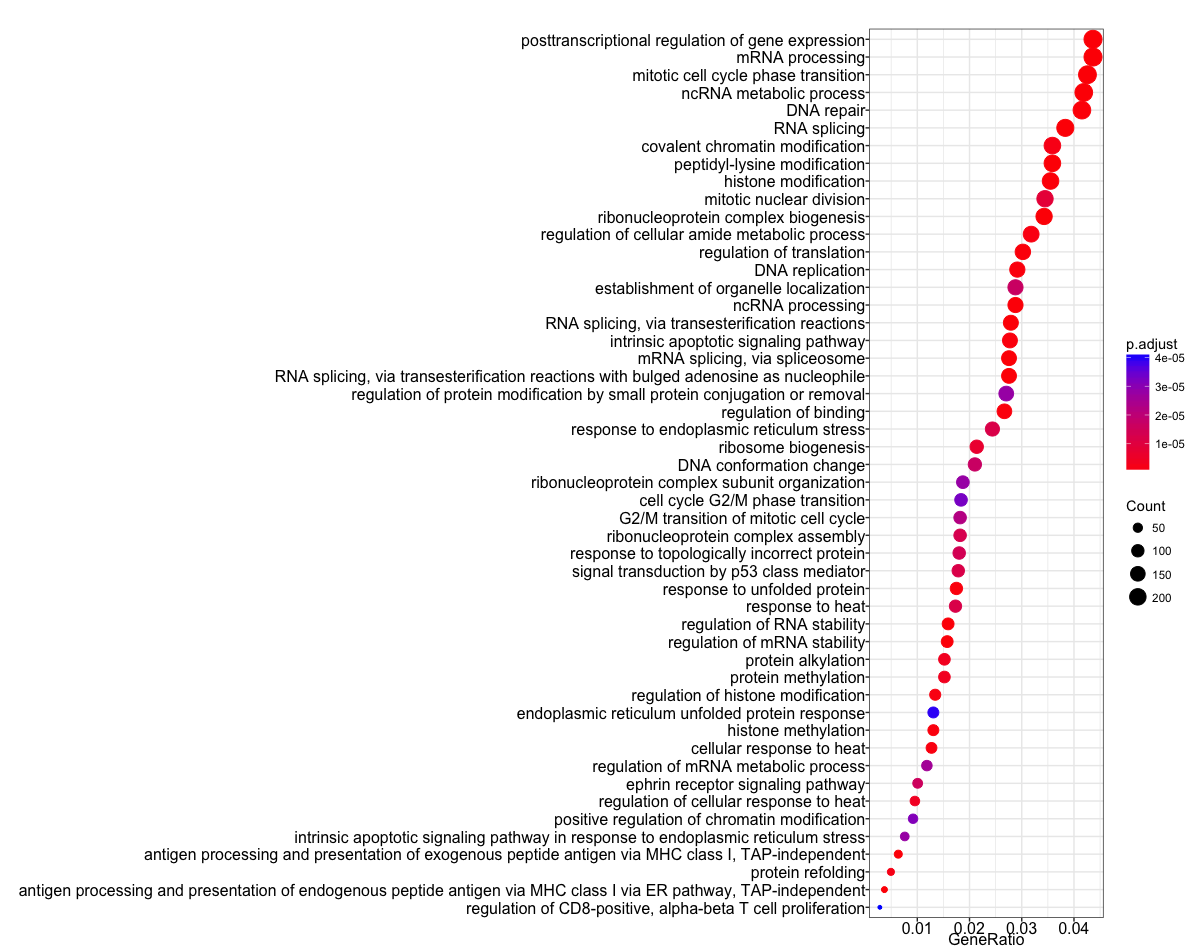
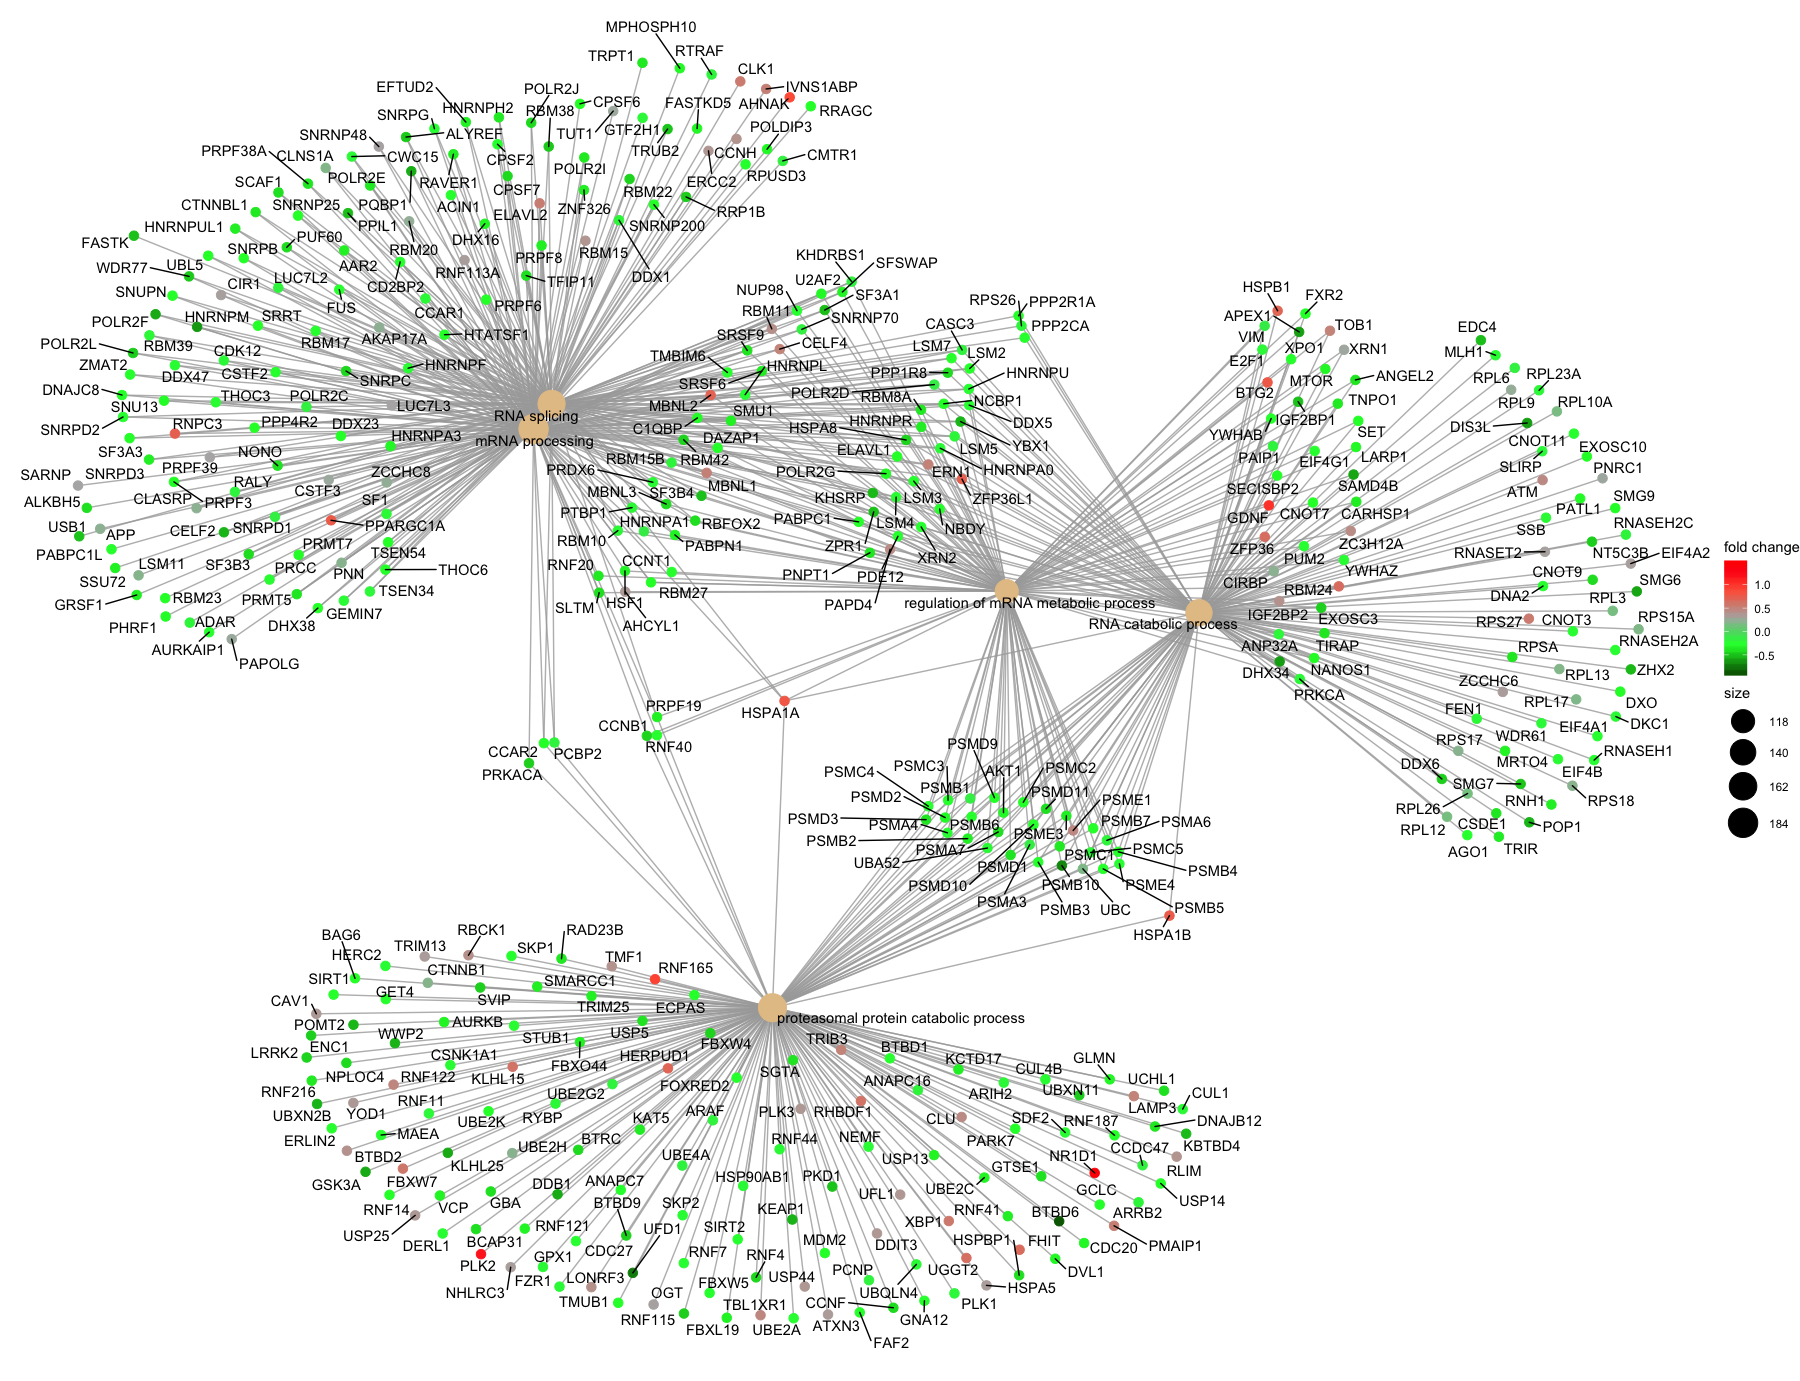
We often use the R package clusterProfiler for performing over-representation analysis with GO (and other functional analyses). In addition to performing the hypergeometric testing, clusterPorfiler is able to create good visualizations of the results; two examples are shown below.
(1) The dotplot shows the number of genes associated with a certain number of GO terms (on the Y-axis), the p-adjusted values for these terms (color) and the gene ratio (# genes related to GO term / total number of sig genes, on the X-axis).
(2) The next plot is the category netplot, this plot shows the relationships between the genes associated with the top five most significant GO terms and the direction of fold change (color).
Other Tools for Functional Analysis
Functional class scoring
The hypothesis behind functional class scoring (FCS) methods is that although large changes in individual genes can have significant effects on pathways (and will be detected via ORA methods), weaker but coordinated changes in sets of functionally related genes (i.e., pathways) can also have significant effects. Thus, rather than setting an arbitrary threshold to identify ‘significant genes’, all genes are considered in the analysis. The gene-level statistics from the dataset are aggregated to generate a single pathway-level statistic and statistical significance of each pathway is reported. This type of analysis can be particularly helpful if the differential expression analysis only outputs a small list of significant DE genes.
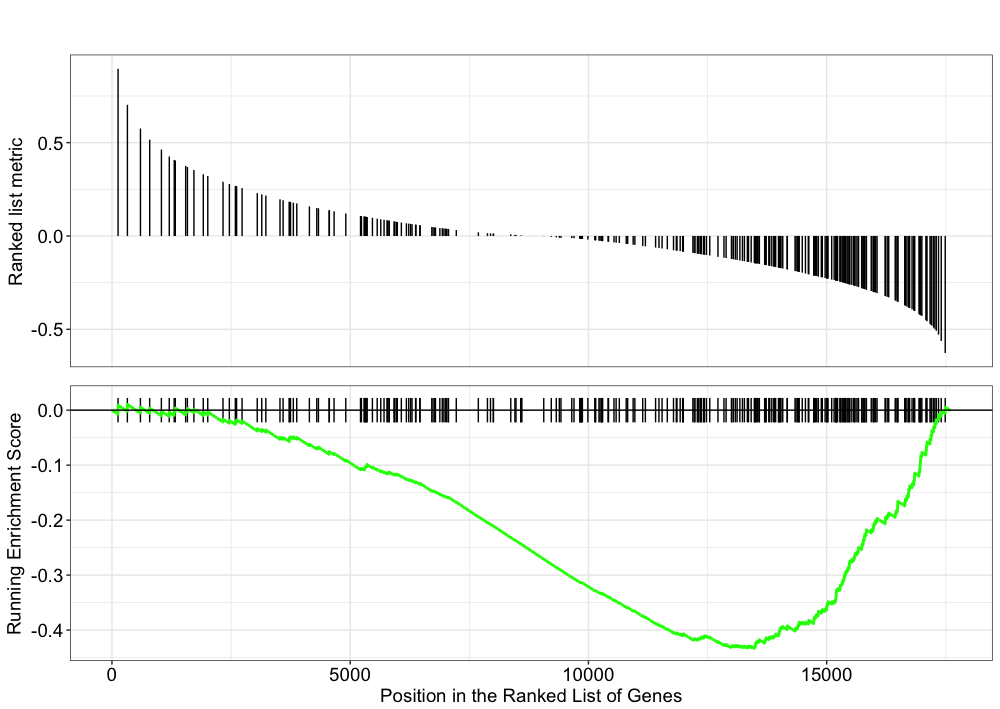
One commonly used tool which is classified under Functional class scoring (FCS), is GSEA. Gene set enrichment analysis utilizes the gene-level statistics or log2 fold changes for all genes to look to see whether gene sets for particular biological pathways are enriched among the large positive or negative fold changes.
Pathway topology tools
The last main type of functional analysis technique is pathway topology analysis. Pathway topology analysis often takes into account gene interaction information along with the fold changes and adjusted p-values from differential expression analysis to identify dysregulated pathways. Depending on the tool, pathway topology tools explore how genes interact with each other (e.g. activation, inhibition, phosphorylation, ubiquitination, etc.) to determine the pathway-level statistics. Pathway topology-based methods utilize the number and type of interactions between gene product (our DE genes) and other gene products to infer gene function or pathway association.
For instance, the SPIA (Signaling Pathway Impact Analysis) tool can be used to integrate the lists of differentially expressed genes, their fold changes, and pathway topology to identify affected pathways. We have step-by-step materials for using SPIA available.
Co-expression clustering
Co-expression clustering is often used to identify genes of novel pathways or networks by grouping genes together based on similar trends in expression. These tools are useful in identifying genes in a pathway, when their participation in a pathway and/or the pathway itself is unknown. These tools cluster genes with similar expression patterns to create ‘modules’ of co-expressed genes which often reflect functionally similar groups of genes. These ‘modules’ can then be compared across conditions or in a time-course experiment to identify any biologically relevant pathway or network information.
You can visualize co-expression clustering using heatmaps, which should be viewed as suggestive only; serious classification of genes needs better methods.
The way the tools perform clustering is by taking the entire expression matrix and computing pair-wise co-expression values. A network is then generated from which we explore the topology to make inferences on gene co-regulation. The WGCNA package (in R) is one example of a more sophisticated method for co-expression clustering.
This lesson has been developed by members of the teaching team at the Harvard Chan Bioinformatics Core (HBC). These are open access materials distributed under the terms of the Creative Commons Attribution license (CC BY 4.0), which permits unrestricted use, distribution, and reproduction in any medium, provided the original author and source are credited.